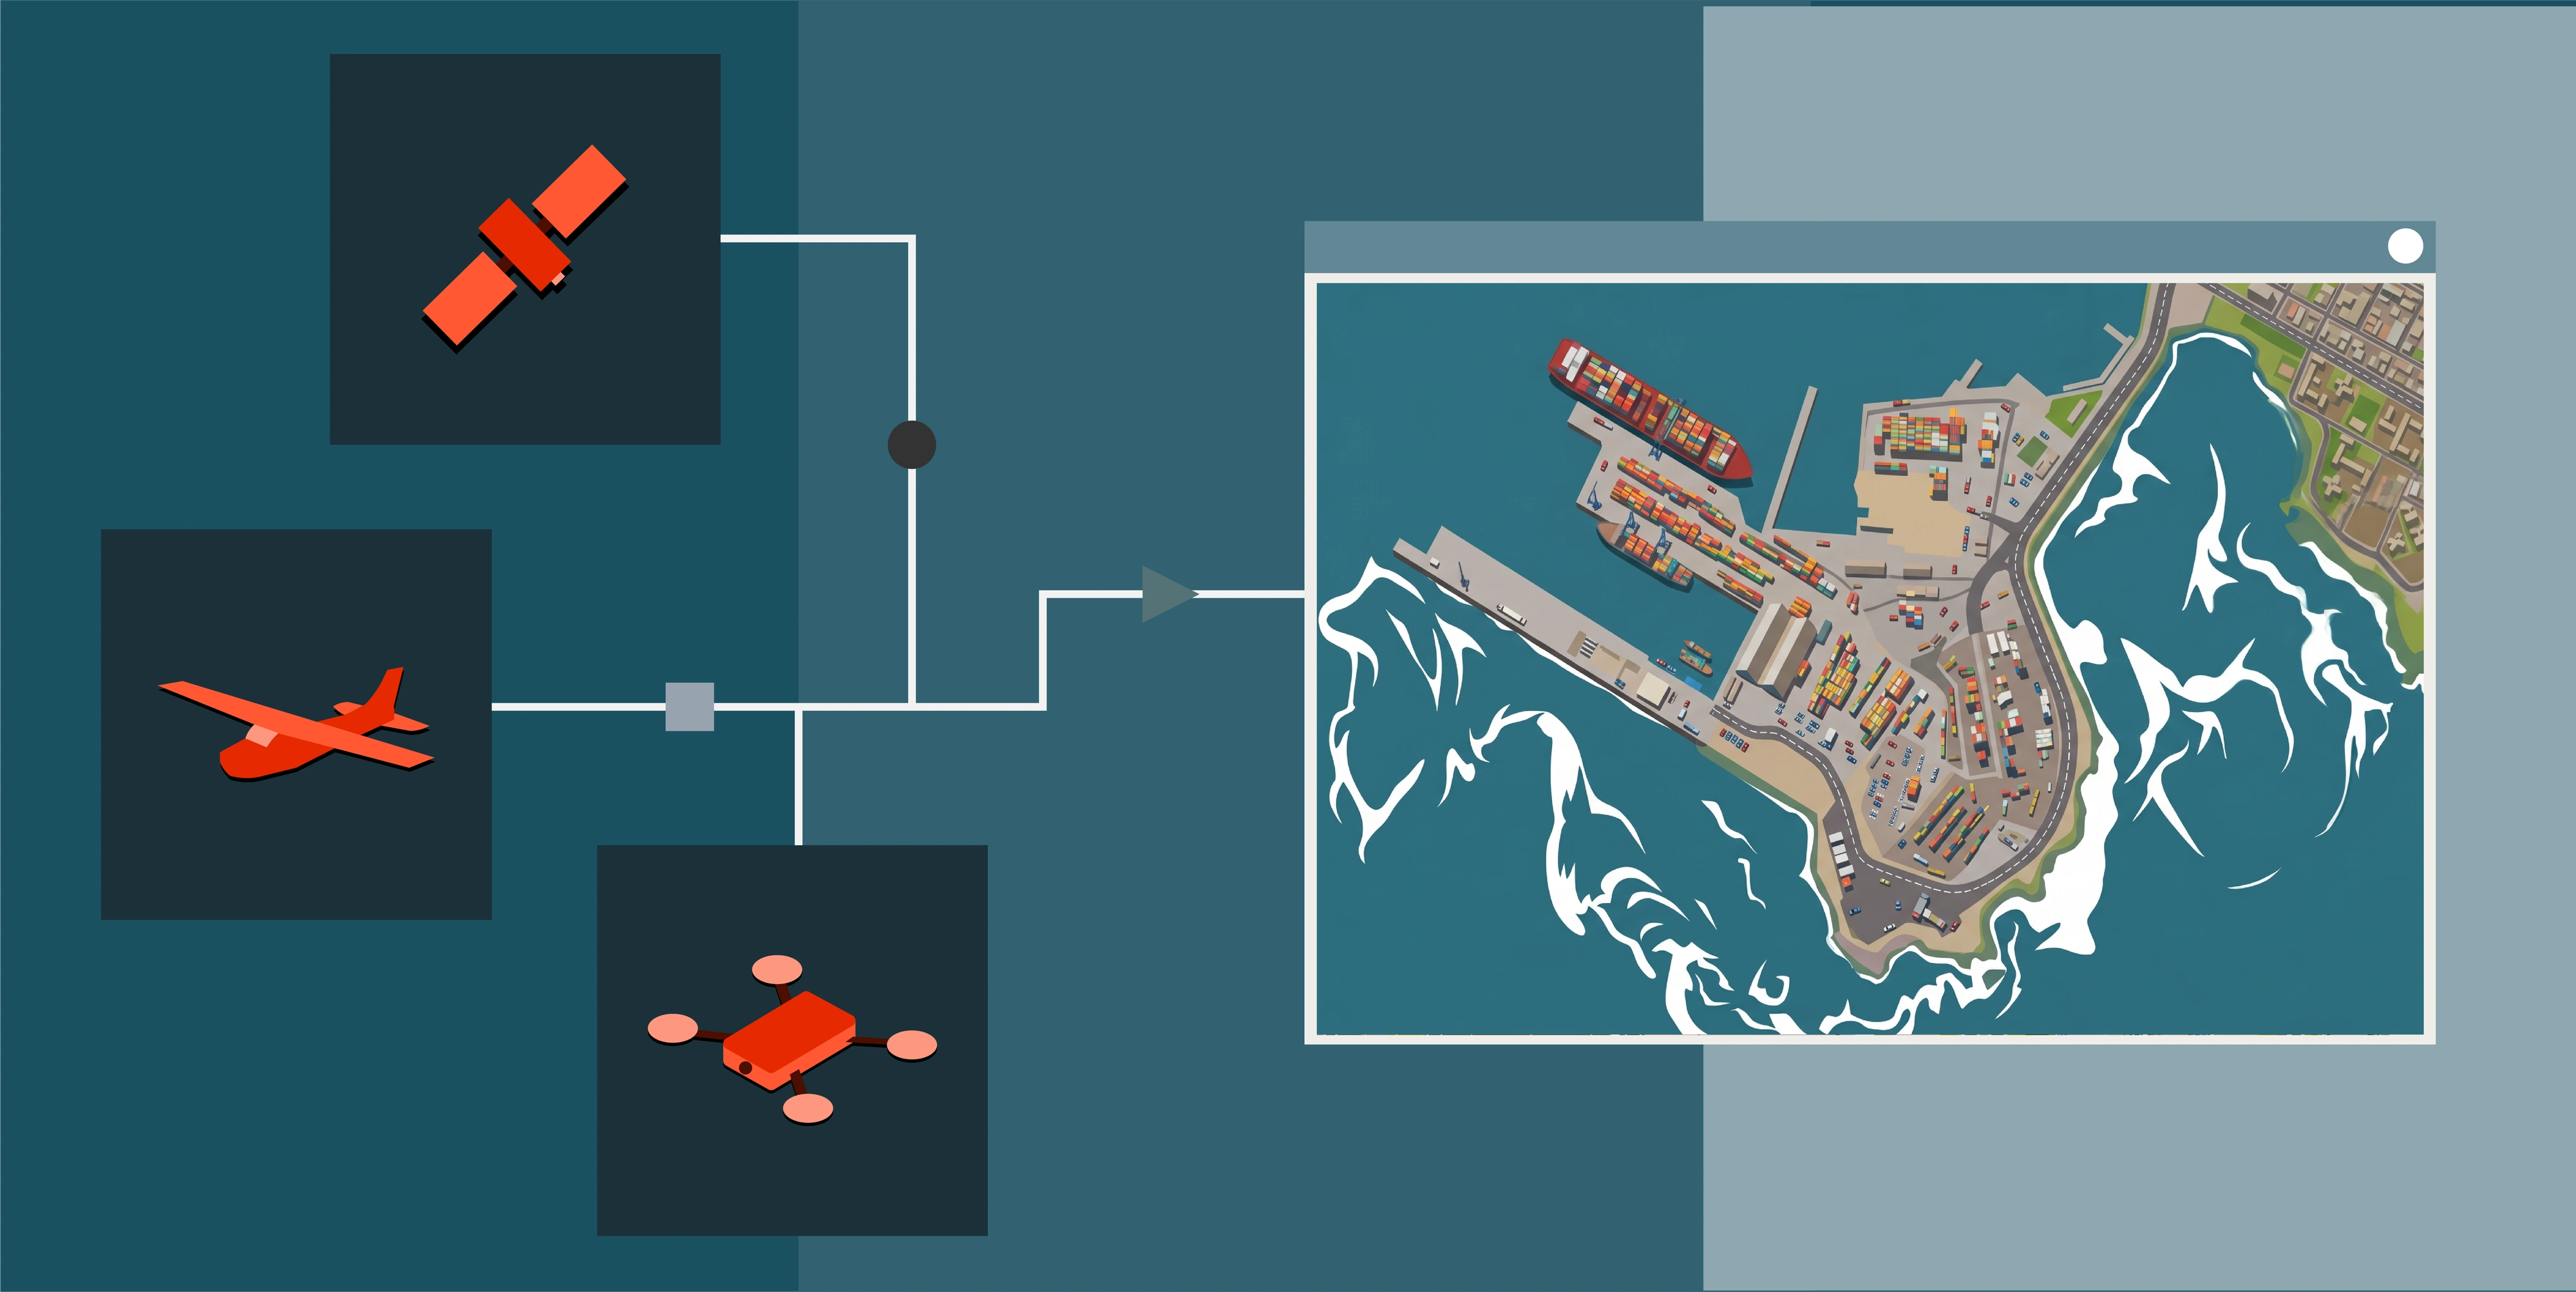
Earth Observation (EO) is the collection of information about the Earth's surface using remote sensing (satellites, aircraft and drones) without needing to be on site.
Most people picture satellite imagery, and that's a big part of it. But Earth Observation also covers radar (SAR), LiDAR, aerial photography, and multispectral, hyperspectral and thermal sensors.
Together, these let organisations monitor change, map assets, measure volumes and assess environmental conditions across mining, infrastructure, environment, agriculture, utilities and energy and government.
How Earth Observation Works
Different materials reflect and emit energy differently at different wavelengths. Sensors measure that energy, and processing turns it into maps, models and measurements.
Passive sensors measure energy that already exists, such as reflected sunlight or emitted heat. Optical, multispectral, hyperspectral and thermal are all passive. They produce intuitive imagery, but cloud, smoke and darkness stop them.
Active sensors send out their own signal and measure the return. SAR and LiDAR work at night, and radar sees through cloud and smoke.
The four resolutions
"Resolution" usually means pixel size, but four things matter:
- Spatial: ground size of a pixel (30cm, 10m, 30m)
- Spectral: how many wavelength bands are recorded
- Temporal: how often the same place is imaged
- Radiometric: how finely brightness levels are distinguished
No sensor maximises all four. Fine detail means narrow coverage and higher cost. Wide coverage and frequent revisit mean coarser pixels. Choosing EO data is deciding which resolution you can afford to give up, a trade-off we cover in more detail in our guide to satellite imagery quality.
Earth Observation Technologies
Satellite Imagery
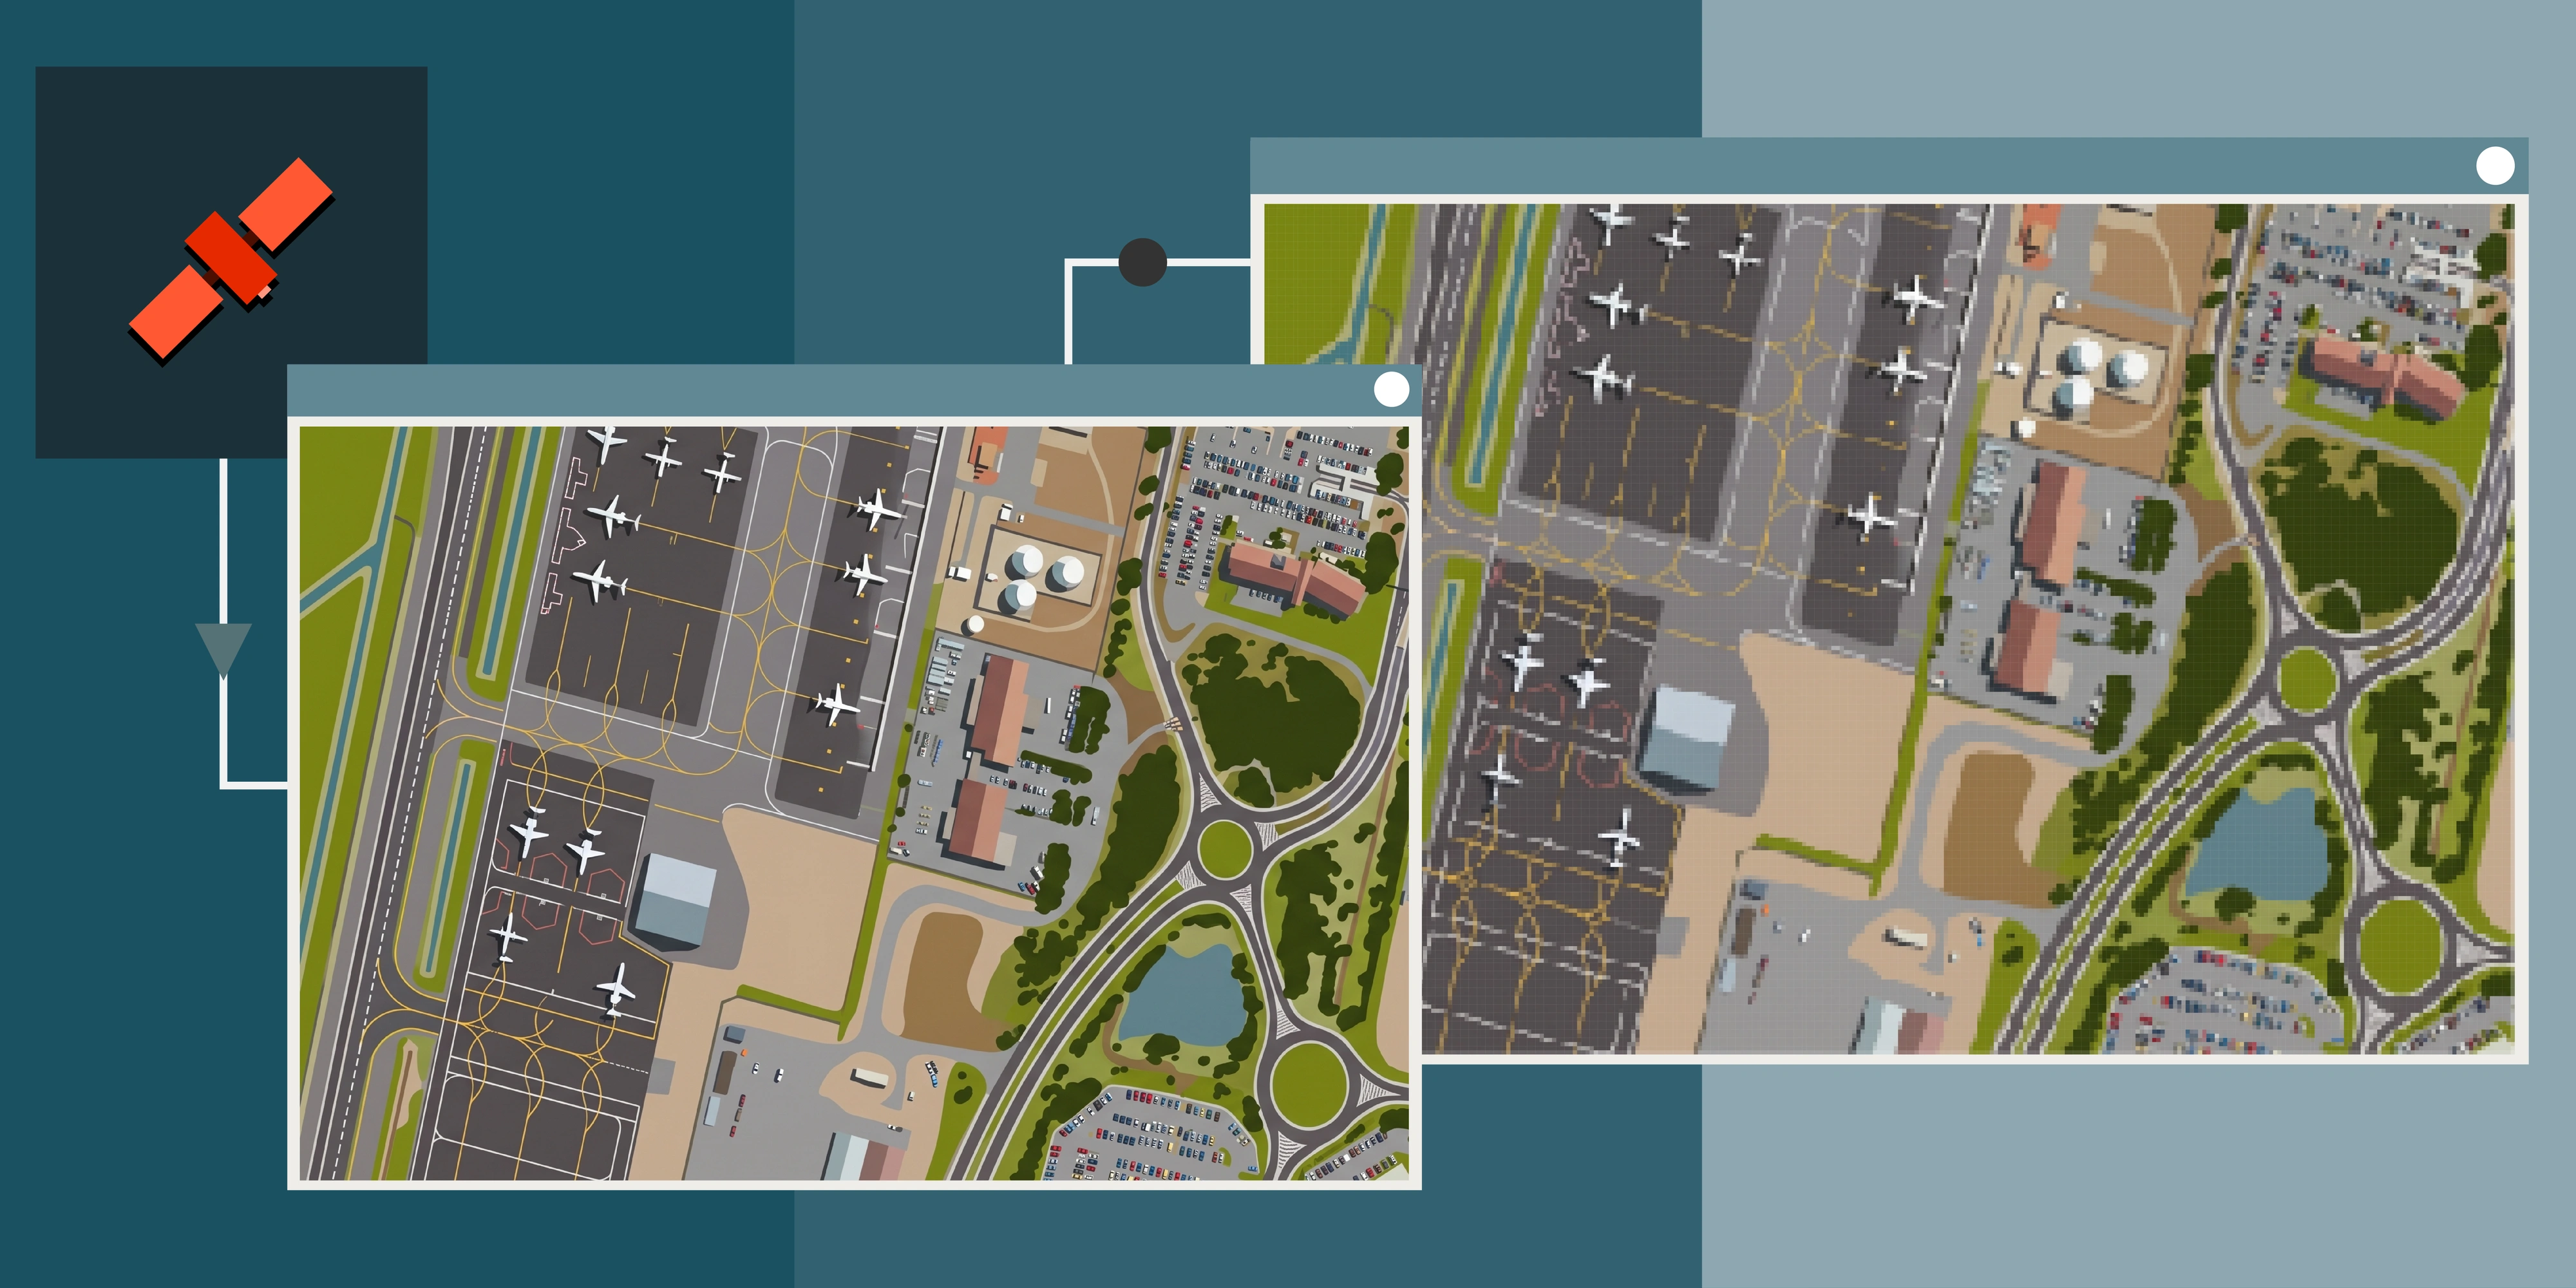
Optical satellites record reflected sunlight. Most collect one high-detail panchromatic band plus lower-resolution colour bands, then combine them (pansharpening) to deliver full-colour imagery at panchromatic detail.
Native 30cm is the very-high-resolution standard today, from constellations like Vantor's WorldView Legion, with some sensors reaching 25cm native as seen with SpaceEye-T from SIIS. You'll also see "HD 15cm" products, which apply resampling and enhancement, usually via trained ML models, to native 30cm imagery for a sharper image, though the underlying information content is derived from the native capture.
Free data remains excellent for many jobs. Sentinel-2 gives 10m colour with a five-day revisit, and Landsat gives 30m with an archive going back five decades, mainly being limited with respect to resolution and assurances on getting areas you are monitoring captured. Our comparison of commercial and free satellite data works through where each one earns its place.
Because satellites revisit the same ground repeatedly, consecutive captures can be aligned and compared directly. That repeat coverage is what makes change detection practical over remote sites.
10 November 2025
11 November 2025
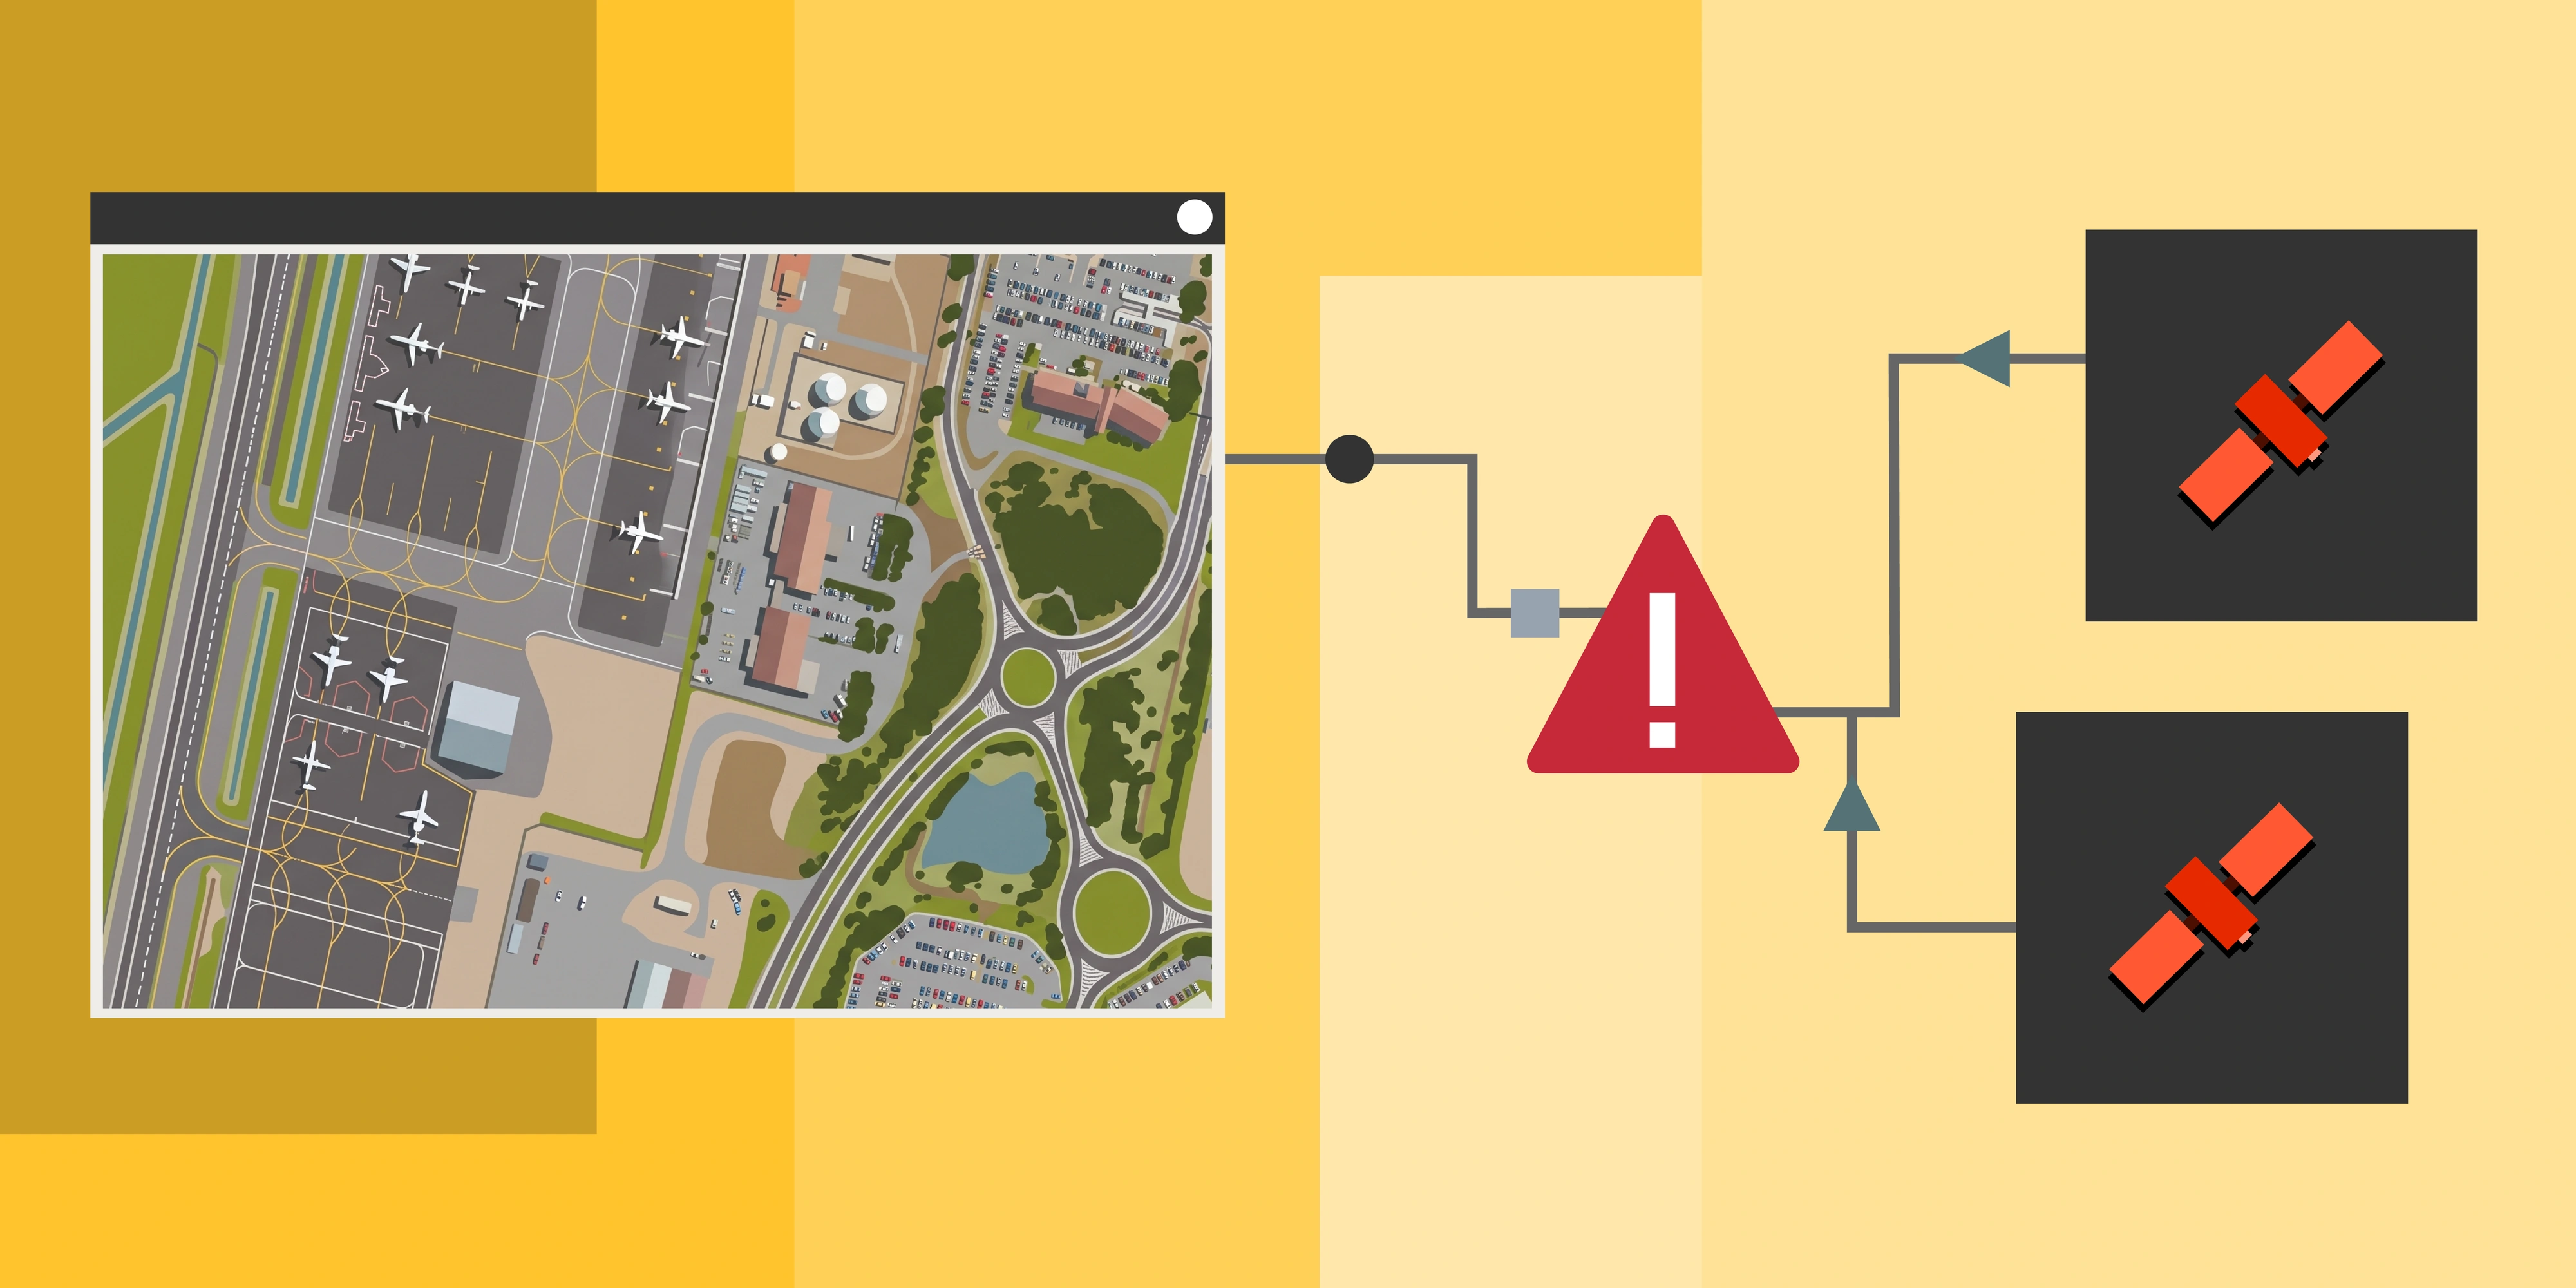
Cloud cover doesn't have to mean a wasted order. Because satellites revisit the same ground repeatedly, a capture that comes back too cloudy can be rejected and reattempted on a later pass. The acceptable cloud threshold is agreed at the time of order, commonly 5 or 10% over the area of interest, and imagery that exceeds it is recaptured rather than delivered. Worth factoring into timelines: in a cloudy season, meeting a tight threshold can take several attempts over cloud prone regions. Our guide to archive versus tasking covers how this affects lead times.
Best for: site monitoring, change detection, historical baselines, land-use mapping. Limits: blocked by cloud, smoke and darkness.
Synthetic Aperture Radar (SAR)
SAR transmits microwave pulses and measures what bounces back. Because it supplies its own energy, it works at night, and radar passes straight through cloud, smoke and most rain.
A SAR image maps surface roughness and geometry, not colour. Smooth water looks black, while buildings and ships look very bright.
Wavelength decides penetration, and it's the most important thing to specify:
Commercial SAR is now widely available (ICEYE, Capella, Umbra, Synspective, COSMO-SkyMed), alongside free Sentinel-1 C-band data. NISAR, launched July 2025, began public L-band data releases in July 2026, a genuinely new free capability for vegetated landscapes.
InSAR: measuring ground movement
Comparing the phase of two radar images reveals how far the ground moved between them, to millimetre precision.
- DInSAR: one image pair, for a single event like a landslide or collapse
- PSInSAR: long time series over stable reflectors, ideal for built-up areas
- SBAS: networked image pairs, better over natural terrain
Two things to plan for. Measurements are taken along the satellite's line of sight, so separating vertical from horizontal movement needs both ascending and descending passes. InSAR also needs coherence, and dense vegetation, water and active earthworks can destroy it.
Best for: tailings dam and pit wall stability, subsidence over underground workings, landslide detection, embankment and pipeline settlement, flood mapping through cloud. Limits: not intuitive to read, struggles in steep terrain, typically needs specialist processing.
Satellite Derived Elevation (Stereo Photogrammetry)
Elevation doesn't have to come from a laser. If a satellite images the same ground twice from different angles, the apparent shift between those views (parallax) can be solved into height, the same way two eyes give you depth. We go deeper on this in our guide to DEMs, DSMs and DTMs from satellite.
Most very-high-resolution satellites can do this in a single pass, pitching forward and back to capture a stereo pair moments apart. Tri-stereo adds a third, near-nadir look, which fills the gaps stereo pairs leave behind tall buildings, in narrow valleys and on steep pit walls.
30cm RGB imagery
50cm satellite derived DTM
Two things drive quality more than the sensor name:
Convergence angle. The angle between the two looks, typically 15 to 30 degrees. Too narrow and height is poorly constrained; too wide and the two images no longer look alike enough to match reliably.
Same-pass capture. Pairs collected minutes apart share sun angle, shadows and site conditions. Pairs assembled from separate passes weeks apart often don't, and matching degrades.
Post spacing usually lands around two to four times the imagery GSD, so 30 to 50cm stereo yields a DSM at roughly 50cm to 1m posts. Relative accuracy across a single scene is generally better than absolute, which matters if you're measuring change rather than tying to a datum.
The output is a DSM: canopy, buildings and infrastructure included. A bare-earth DTM can be processed from it, but photogrammetry only ever sees the top surface, so under closed canopy the filtering is an estimate, not a measurement. This is the single most important difference from LiDAR, which physically sees the ground through gaps in the foliage.
Matching also needs visual texture. Open water, fresh snow, uniform sand and deep shadow give the algorithm nothing to lock onto, and those areas come back as voids or noise.
Where it earns its place
Elevation over very large or remote areas, where a LiDAR campaign is uneconomic or the site is simply too far to mobilise to. It's also the practical option for overseas and access-restricted sites, and for baseline terrain ahead of design, when you need the shape of the landscape rather than defensible engineering accuracy. Our article on where to use DEMs walks through the industry applications in detail.
Best for: regional and remote-area DSMs, pre-feasibility and route selection, large-scale volumetrics, 3D site models, historical terrain reconstruction. Limits: cloud dependent, no canopy penetration, roughly an order of magnitude below LiDAR accuracy, and needs ground control to hit its better numbers.
LiDAR
A scanning laser fires up to two million pulses per second and times each return, building a dense 3D point cloud with offerings from both drone and aerial captures.
Its key advantage is multiple returns. Part of a pulse hits the canopy, and the rest passes through gaps to the ground. That's why LiDAR can map terrain under trees when nothing optical can.
Accuracy: typically 5 to 15cm vertical and 10 to 30cm horizontal from aircraft. Worth knowing: accuracy matters more than density. A 2 pts/m² dataset at 5cm accuracy beats a 10 pts/m² dataset at 30cm.
The three elevation models, and why the difference matters:
- DSM: everything on the surface, including canopy, buildings and powerlines. Use for line-of-sight, solar and vegetation encroachment.
- DTM: bare earth, with vegetation and structures removed. Use for engineering, earthworks and flood modelling.
- DEM: the generic term for any elevation grid. Often used to mean bare earth, so always confirm which surface you're buying.
Bathymetric LiDAR adds a green 532nm laser that penetrates water, mapping riverbeds and seafloor to roughly three times the Secchi (clarity) depth, which is over 30m in clear water. It captures land and seabed in one pass, making it the standard for coastal work.
Best for: engineering design, flood modelling, corridor mapping, forestry, volumetrics, mine planning. Limits: high cost per km², needs aircraft and clear weather, captures shape but not material.
Aerial Imagery
Crewed aircraft deliver very high resolution (2 to 20cm) over defined areas. Overlapping images are processed into orthophotos: imagery with distortion removed so it can be measured like a map.
Oblique imagery (captured at an angle) shows building facades and vertical structures that never appear looking straight down, making it valuable for inspections and valuation.
Best for: engineering design, urban mapping, asset inspection. Limits: needs flight planning, airspace approval and clear weather.
Drone Mapping
Drones give centimetre detail over smaller sites, on demand. Accuracy depends far more on positioning method than on the aircraft:
Stockpile volumes land within 1 to 3% with proper ground control, though the result is only as good as the base surface you measure against.
Best for: construction progress, stockpile volumes, site surveys, inspections. Limits: small coverage area, CASA approvals required, weather and access dependent.
Multispectral Imagery
Multispectral sensors record 4 to 13 discrete bands, turning imagery into measurement. Combining bands produces indices:
The value is that these are repeatable. With consistent atmospheric correction, a reading from March can be compared directly against one from last November, provided seasonal stage and antecedent rainfall are accounted for in the interpretation. That kind of like-for-like comparison is exactly what compliance reporting needs.
Going further: our guide to band combinations and indices shows what each composite and index actually reveals, with worked examples and the band numbers for each sensor.
Hyperspectral Imagery
Where multispectral samples the spectrum at a few points, hyperspectral draws the whole curve, with hundreds of narrow bands per pixel. Because minerals, plants and contaminants each absorb light at characteristic wavelengths, that spectrum acts as a fingerprint for identifying materials, not just classifying appearance.
RGB
PCA
Best for: mineral mapping and exploration, tailings and acid drainage characterisation, gas leak detection, water quality, species-level vegetation mapping.
Thermal Infrared
Thermal sensors measure emitted heat rather than reflected light, so they work day and night. Night-time capture is often more useful, since it removes solar heating and reveals a surface's true thermal behaviour. That's how thermal imagery distinguishes mined ground from surrounding land.
Best for: hot spot and spontaneous combustion detection, urban heat mapping, irrigation efficiency, active fire monitoring, thermal plume discharge.
Comparing the Technologies
Common Earth Observation Products
Imagery: orthorectified satellite imagery, multispectral and surface reflectance, SAR amplitude, aerial orthophotos, basemaps and mosaics
Elevation and 3D: DEM, DSM, DTM, classified point clouds, contours, canopy height models
Derived: change detection, vegetation index time series, InSAR deformation maps, land cover classification, volumetrics, feature extraction, flood and burn severity mapping
Most are delivered as analysis-ready data: already corrected, orthorectified and projected, so they drop straight into GIS, CAD or BI workflows.
Earth Observation in Australia
Australian conditions reward the right technology choice.
Distance. Sites are often hundreds of kilometres from anywhere. Satellite tasking avoids the mobilisation cost and lead time of sending crews or aircraft, which is why remote site monitoring leans so heavily on EO.
Cloud. Northern Australia's wet season blocks optical imagery for months, often exactly when flood and cyclone monitoring matters most. SAR helps for guaranteed captures within these conditions.
Vegetation. Eucalypt canopy lets LiDAR through reasonably well, but frequently defeats X-band and C-band InSAR. L-band, including the new NISAR archive, suits Australian conditions better.
Strong open data. Geoscience Australia's ELVIS platform provides national elevation and bathymetry data, including a 5m LiDAR-derived DEM and state-contributed 1m and 2m models. Digital Earth Australia supplies analysis-ready satellite time series.
Choosing the Right Solution
Work through it in this order:
- What's the smallest thing you need to see? This sets your resolution floor.
- How often do you need to know? Annual reporting and daily awareness lead to very different solutions. See how often satellite imagery is updated.
- What could stop you capturing? If cloud or smoke could block you when it matters most, you need SAR.
- Do you need shape or substance? Elevation and volume point to satellite derived DEMs or LiDAR. Condition and composition point to multispectral or hyperspectral. Movement points to InSAR.
- What accuracy must you defend? If the number goes in a regulatory or investor report, validation matters more than the resolution headline.
Combining datasets usually wins
Rarely does one dataset do everything. High-resolution satellite imagery gives frequent, cost-effective coverage over large areas, while aerial LiDAR gives precise elevation for engineering and volumetrics. Used together, you get broad regular monitoring plus precision where it's actually needed.
Frequently Asked Questions
Can satellites see through cloud? Optical satellites can't. SAR satellites can, and they work at night too.
What's the difference between DEM, DSM and DTM? DSM includes canopy and buildings. DTM is bare earth. DEM is the generic term for any elevation grid, so always confirm which surface you're getting.
How accurate is LiDAR? Around 5 to 15cm vertical and 10 to 30cm horizontal from aircraft. Bathymetric LiDAR is roughly 15 to 25cm vertical.
Is free satellite data good enough? Sentinel-2 and Landsat answer many regional monitoring, vegetation and change questions. Commercial data earns its cost when you need finer detail, guaranteed timing or specific sensor types.
How quickly can I get imagery? Archive imagery typically arrives within a few business days. Urgent tasking over Australia can deliver within 24 to 48 hours in good conditions.
Earth Observation at Terrabit
Terrabit helps organisations access and manage commercial Earth Observation data across Australia and internationally, from high-resolution satellite imagery and elevation products to customised monitoring programs. Our team works with clients to identify the most suitable data for each project, and to avoid paying for capability a project doesn't need.
You can work directly with our experienced geospatial team who will guide you through options best fit for your usecase, or manage projects through Albatross, our platform for searching archive imagery, requesting new acquisitions, tracking orders and accessing completed datasets across multiple satellite providers in one place.
Ready to put Earth Observation to work on your next project? Browse active constellations on the Satellites page, explore Albatross or talk to the Terrabit team about your requirements.