Solutions / Industries / Energy
Satellite imagery for energy.
High-resolution imagery and elevation models for pipelines, transmission, refineries, solar and wind - see what's changing across every asset and act on it.
Value chain
Across the entire energy value chain.
Upstream through downstream, transmission through renewables - each sub-sector matched to the sensors, cadence and analytics that give operators the clearest possible picture of what's happening on the ground.
Upstream
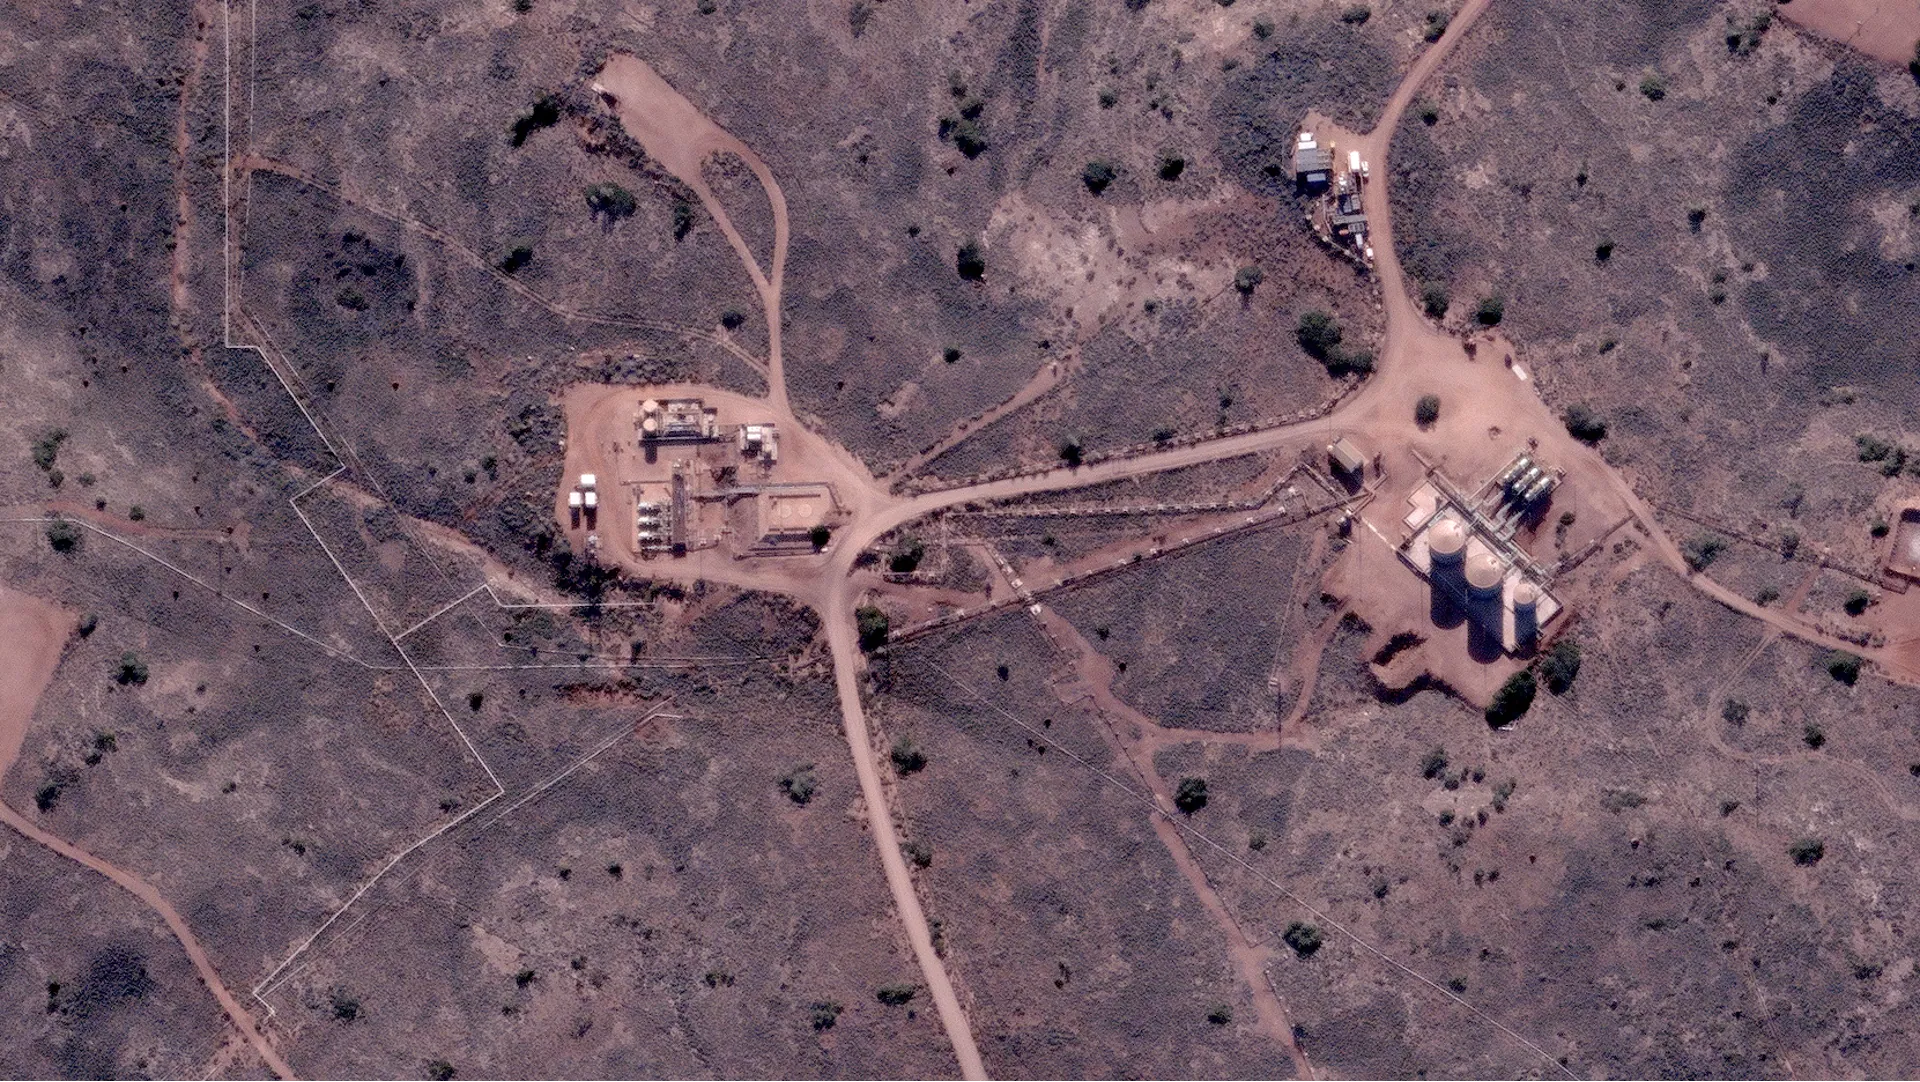
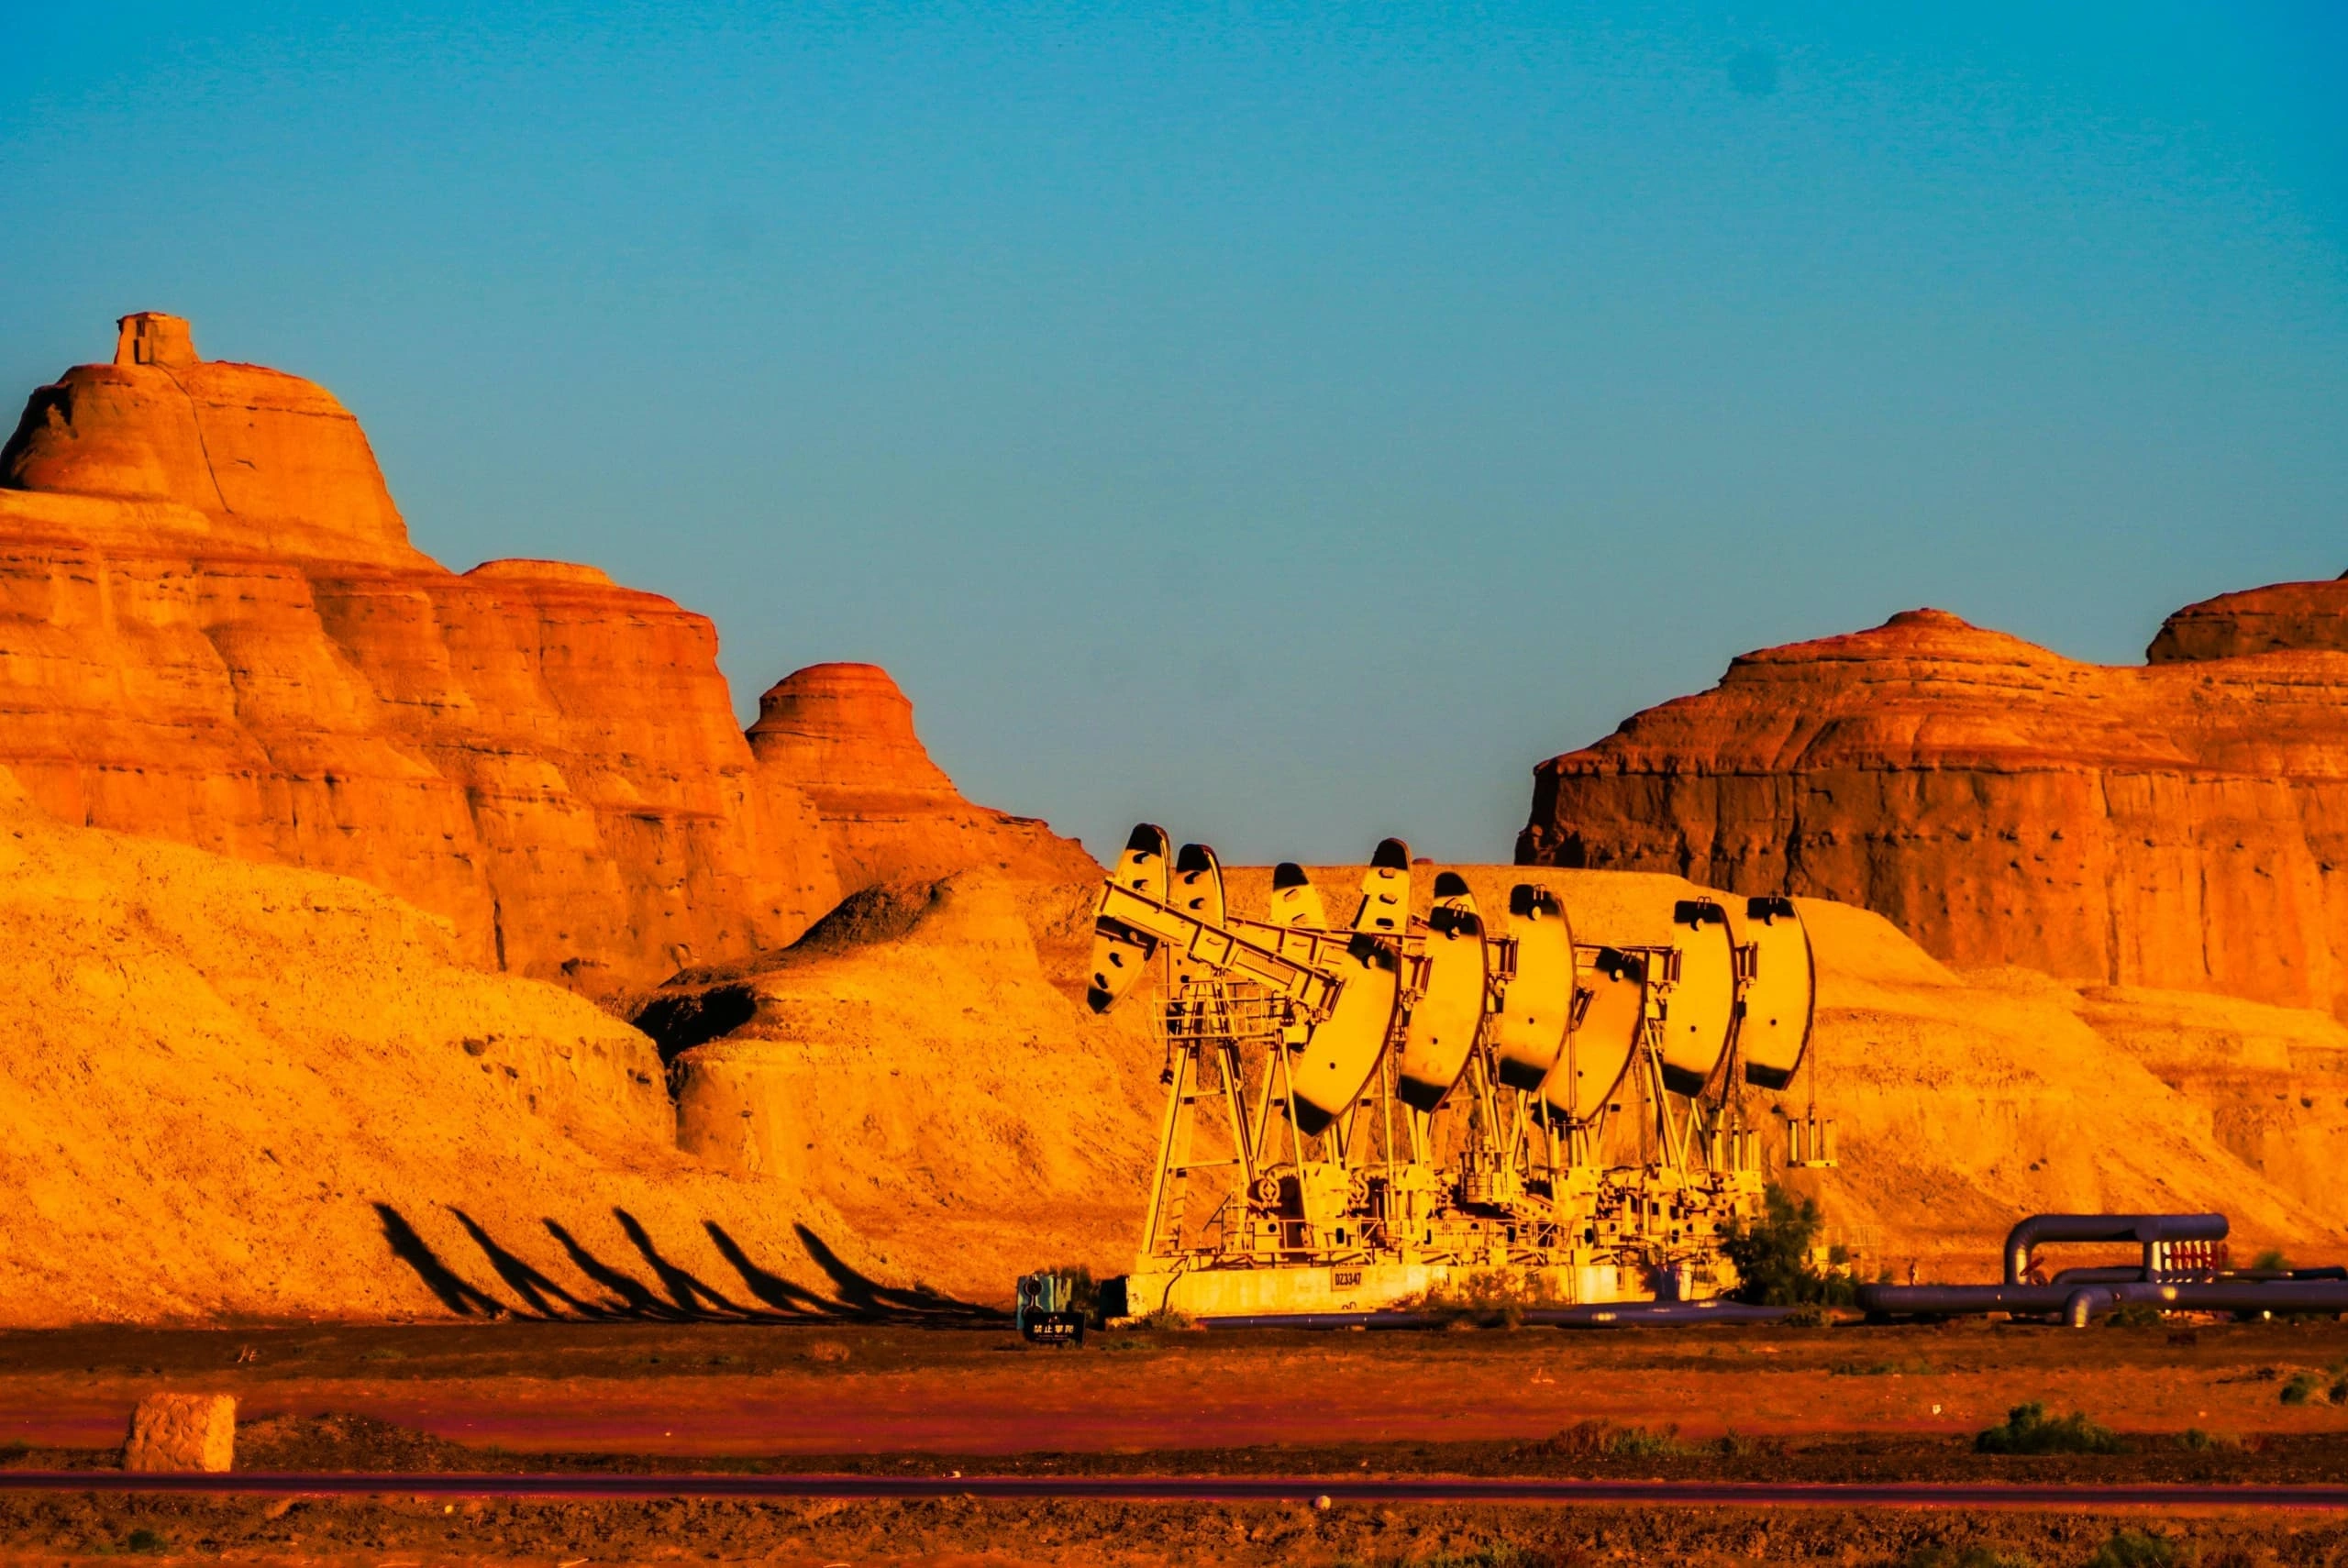
Wellpad activity monitoring, exploration multispectral, drill-site disturbance tracking and ESG baselines for frontier basins.
Midstream
Pipeline right-of-way encroachment, terminal and LNG activity, vessel movement at terminals - high-resolution commercial optical on a scheduled cadence.
Downstream
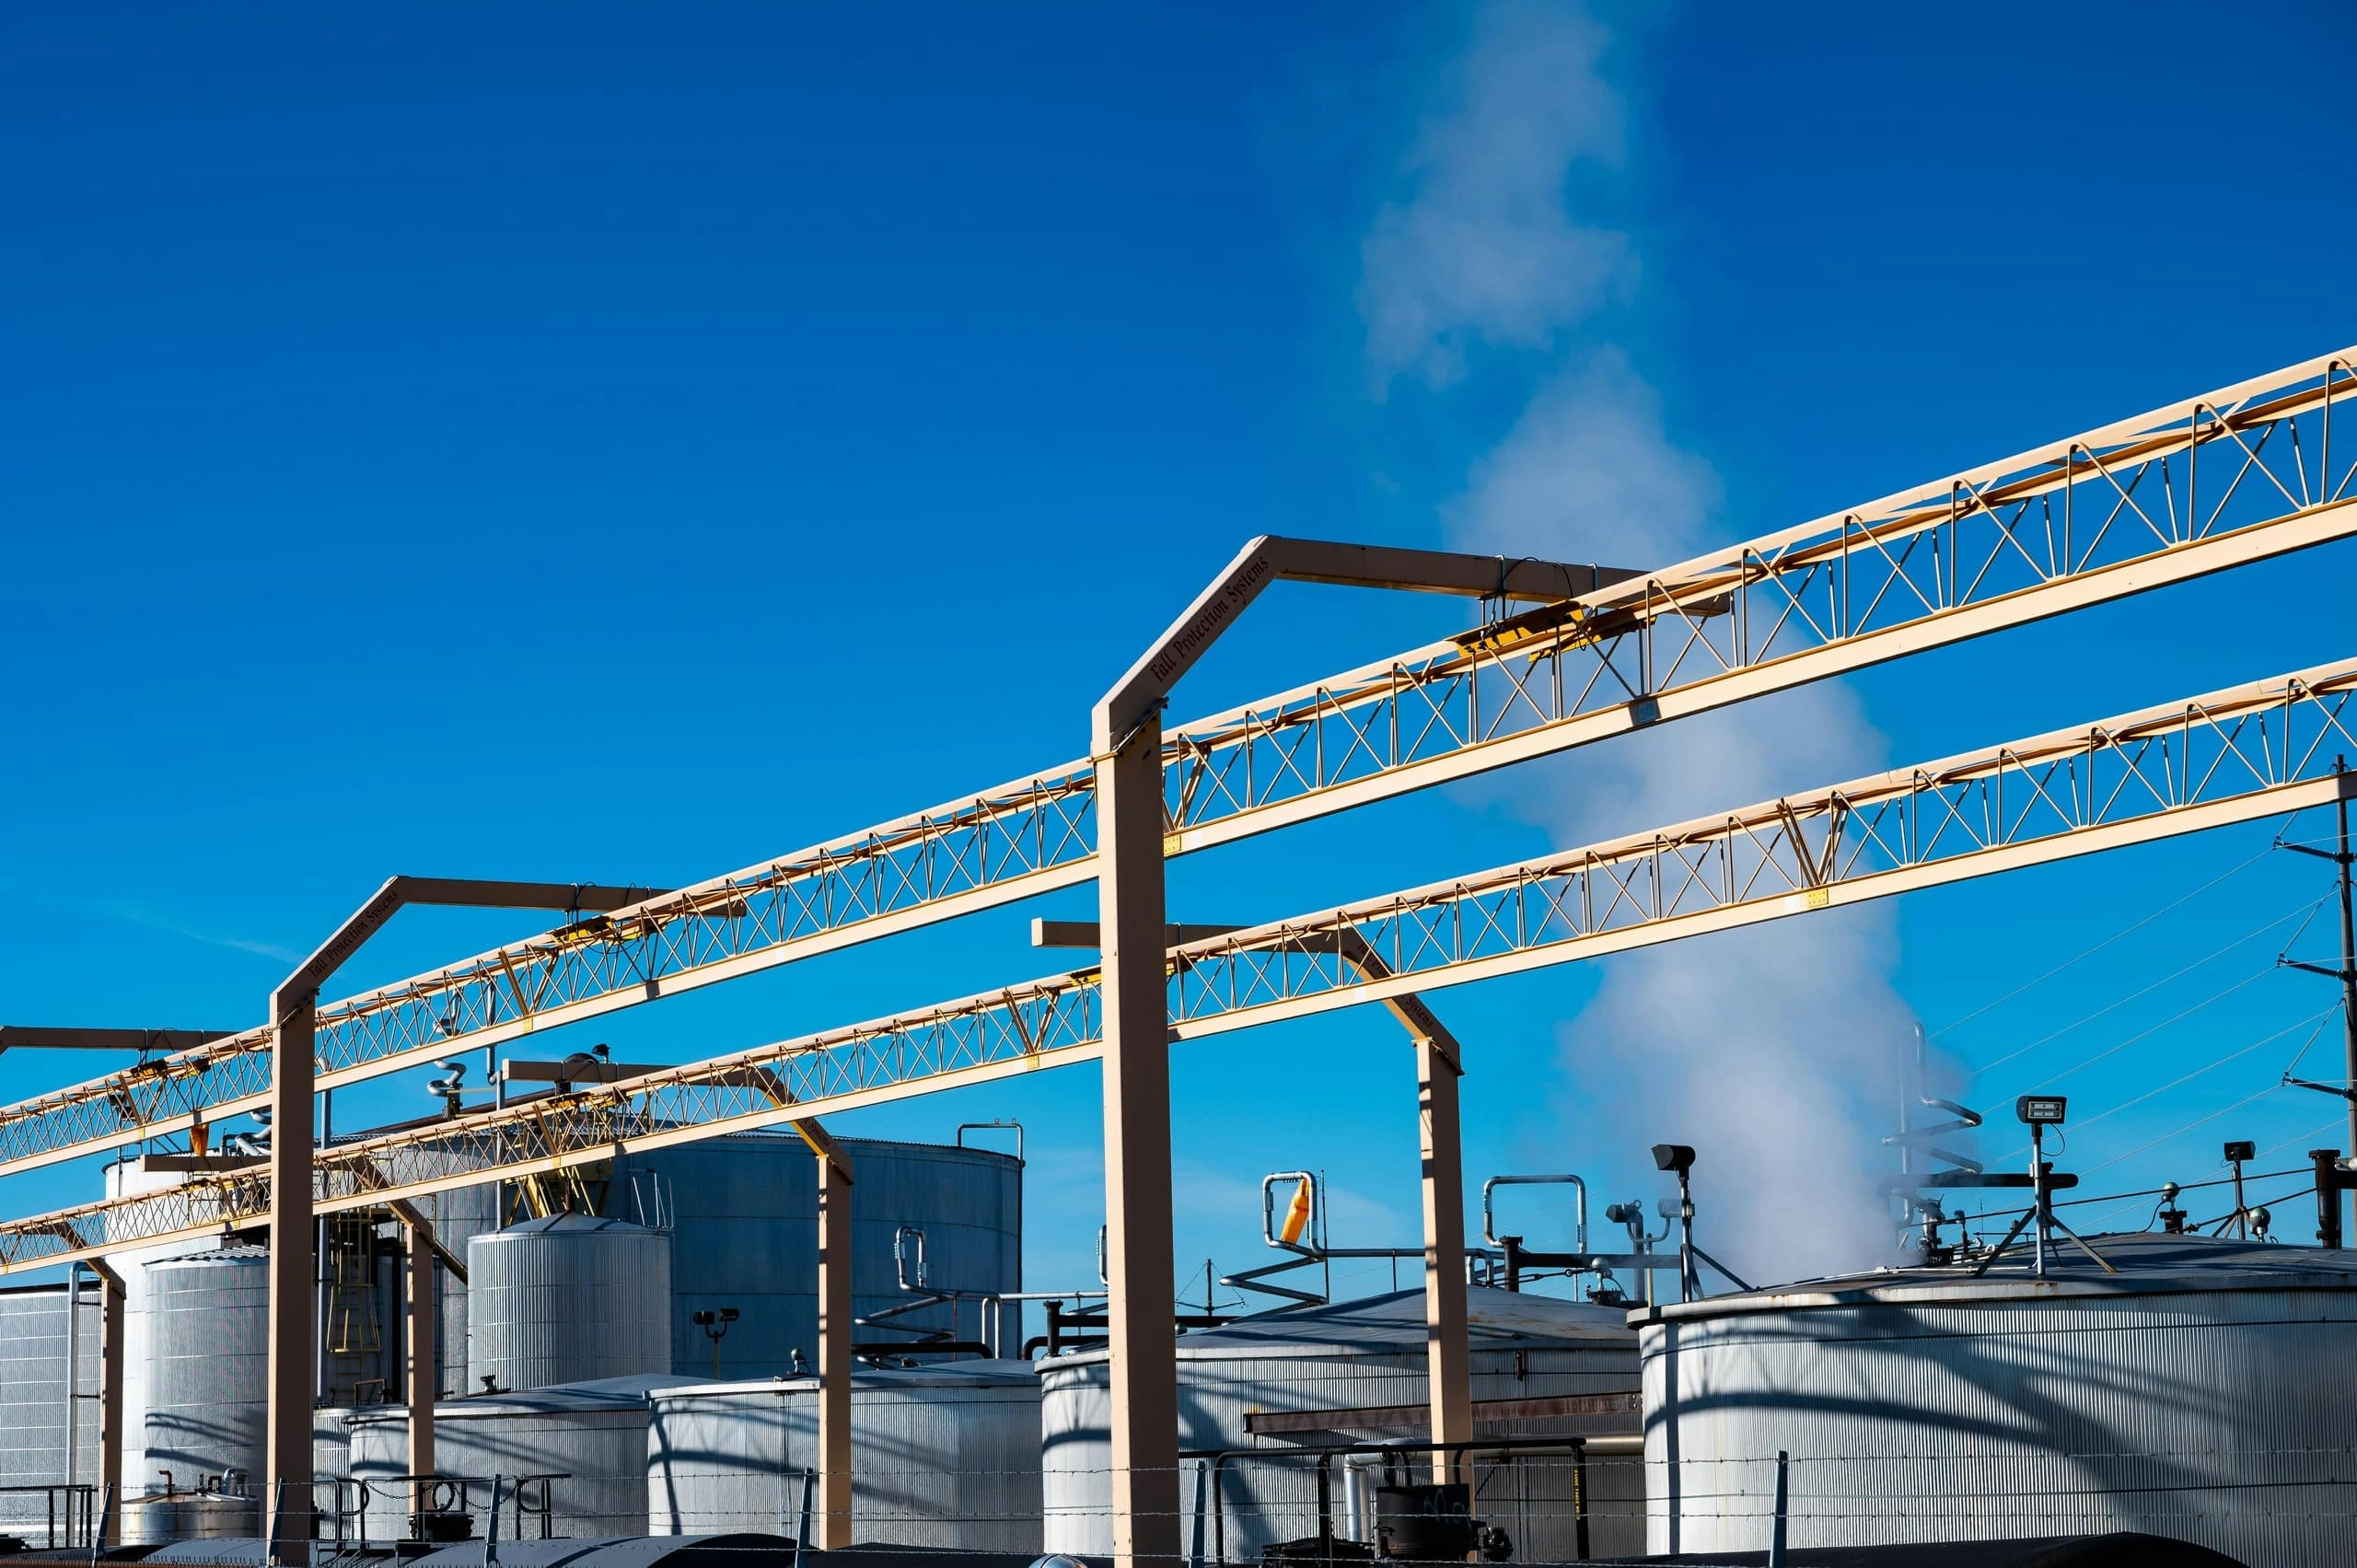
Refinery activity, storage tank monitoring and turnaround status.
Transmission & distribution
Power-line vegetation management, tower and substation change detection, corridor monitoring - scheduled, network-wide.
Renewables
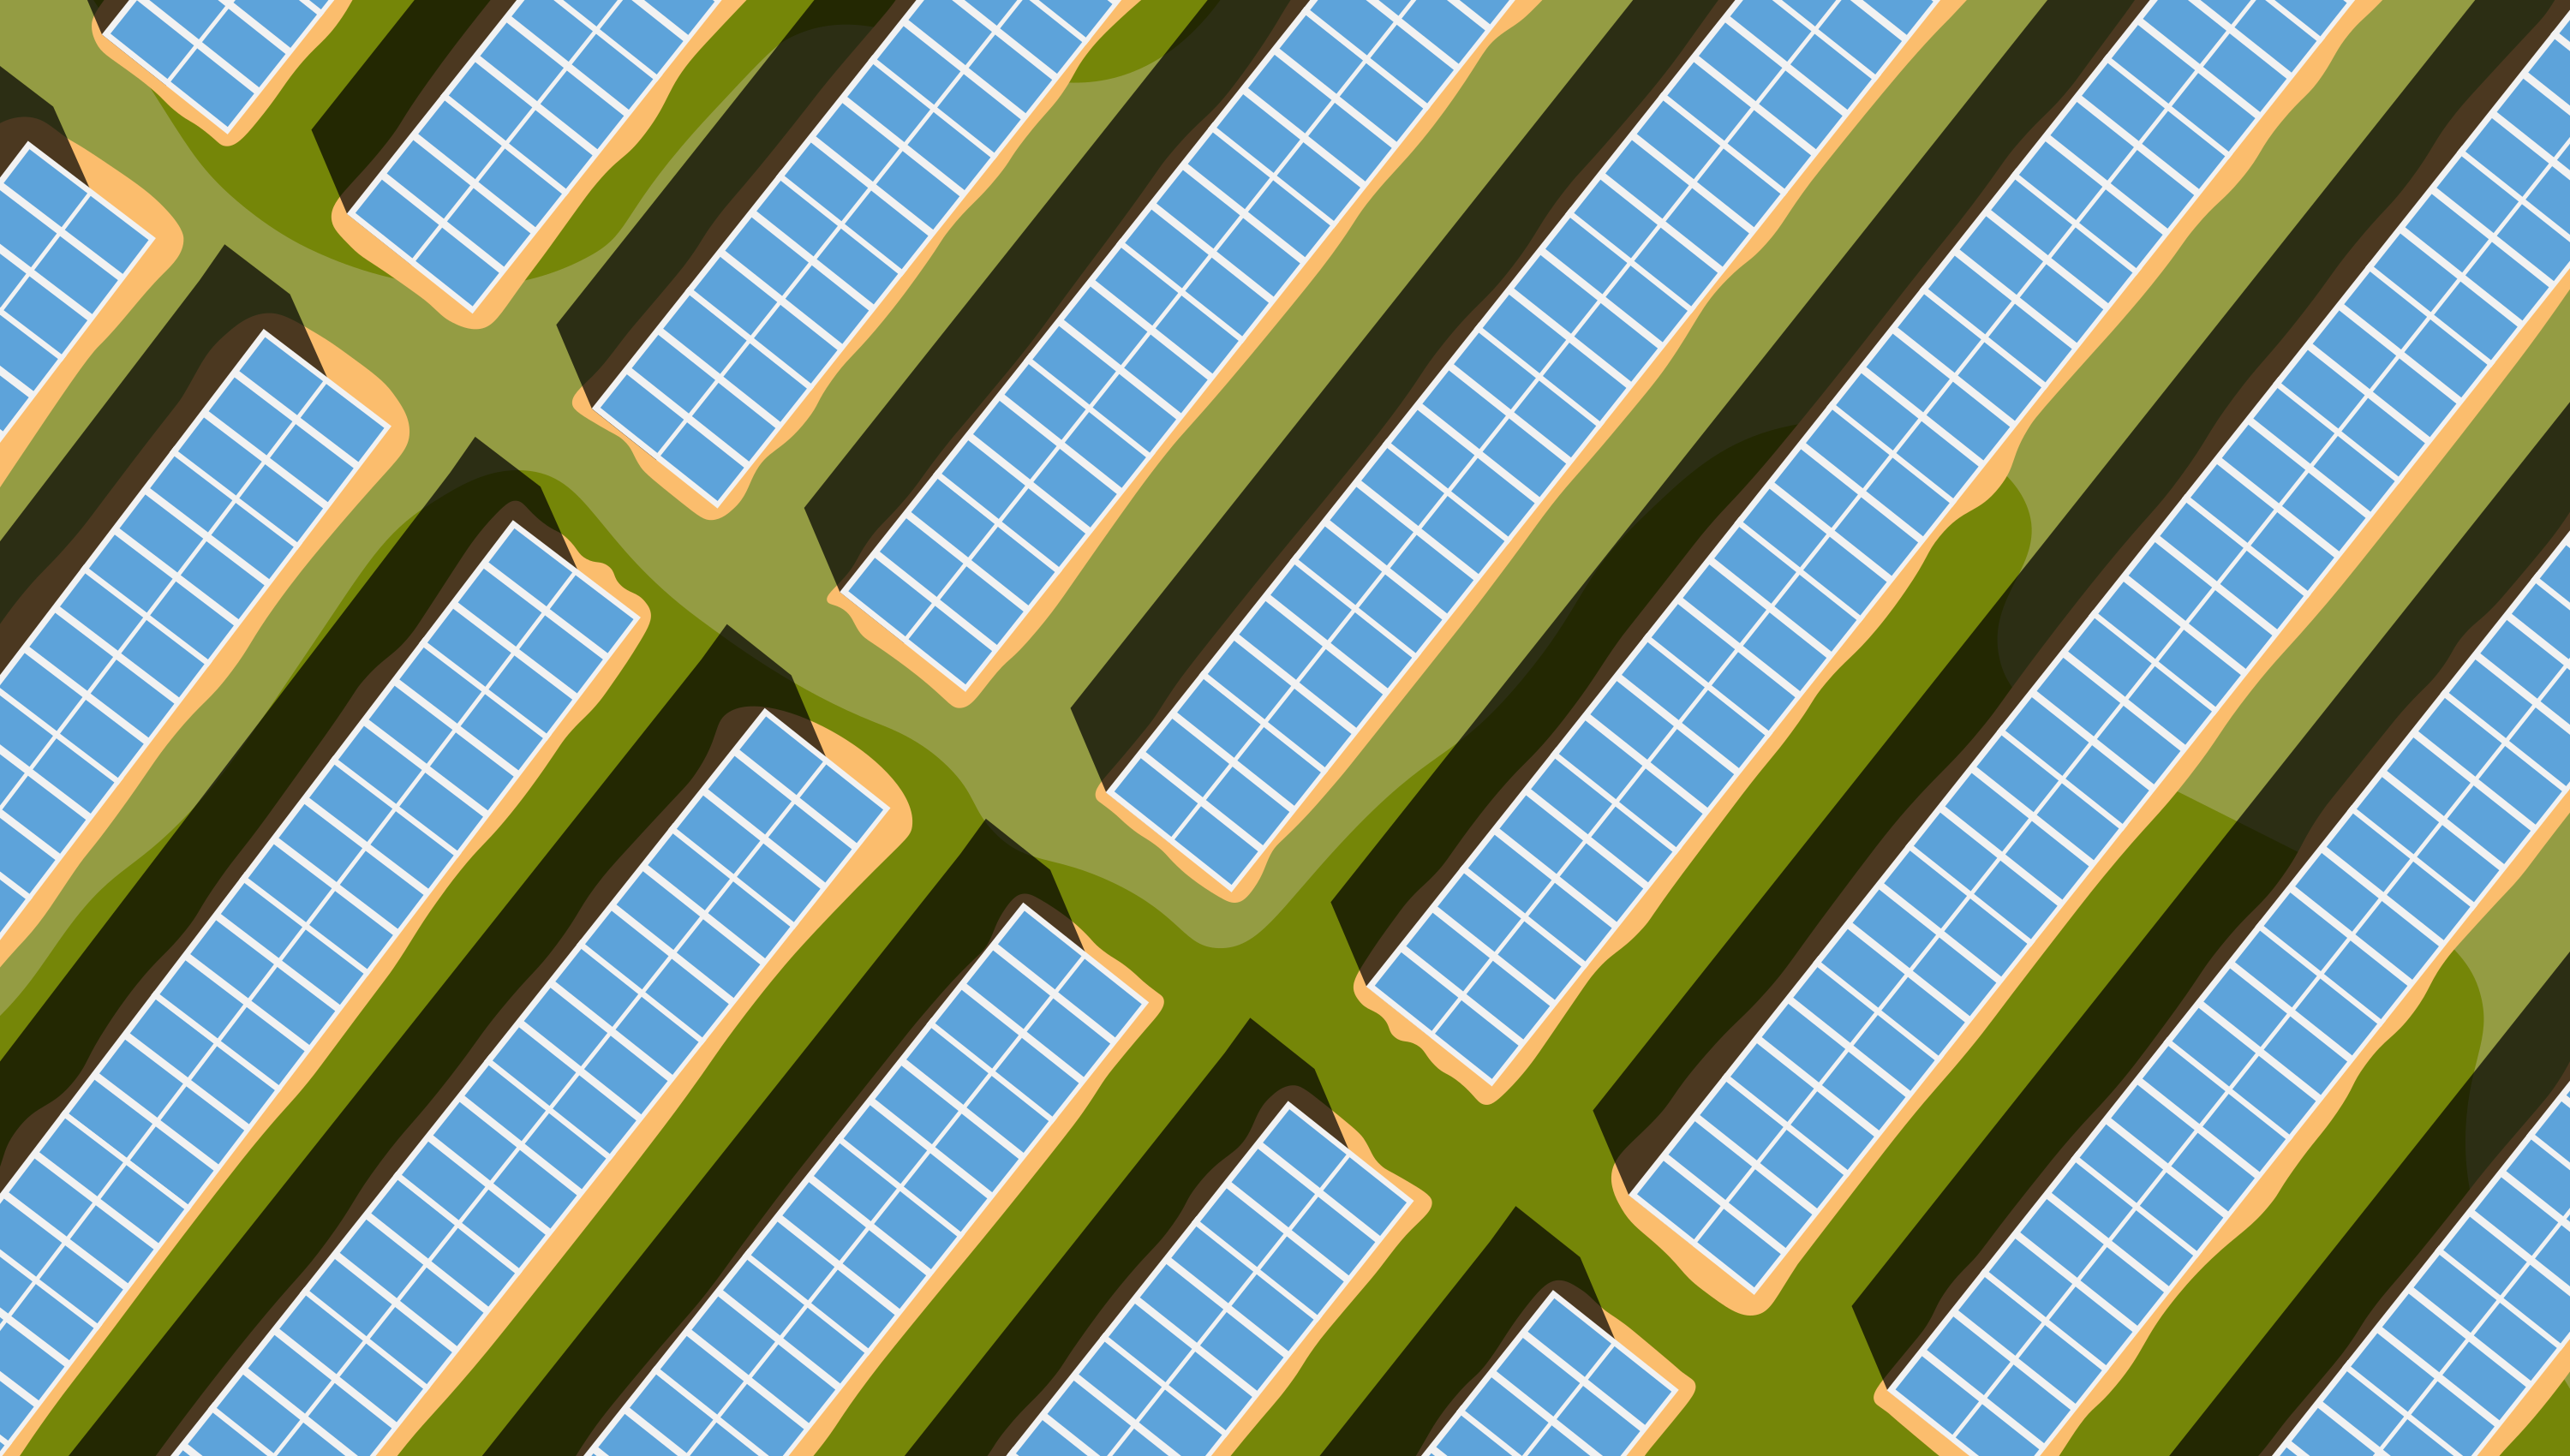
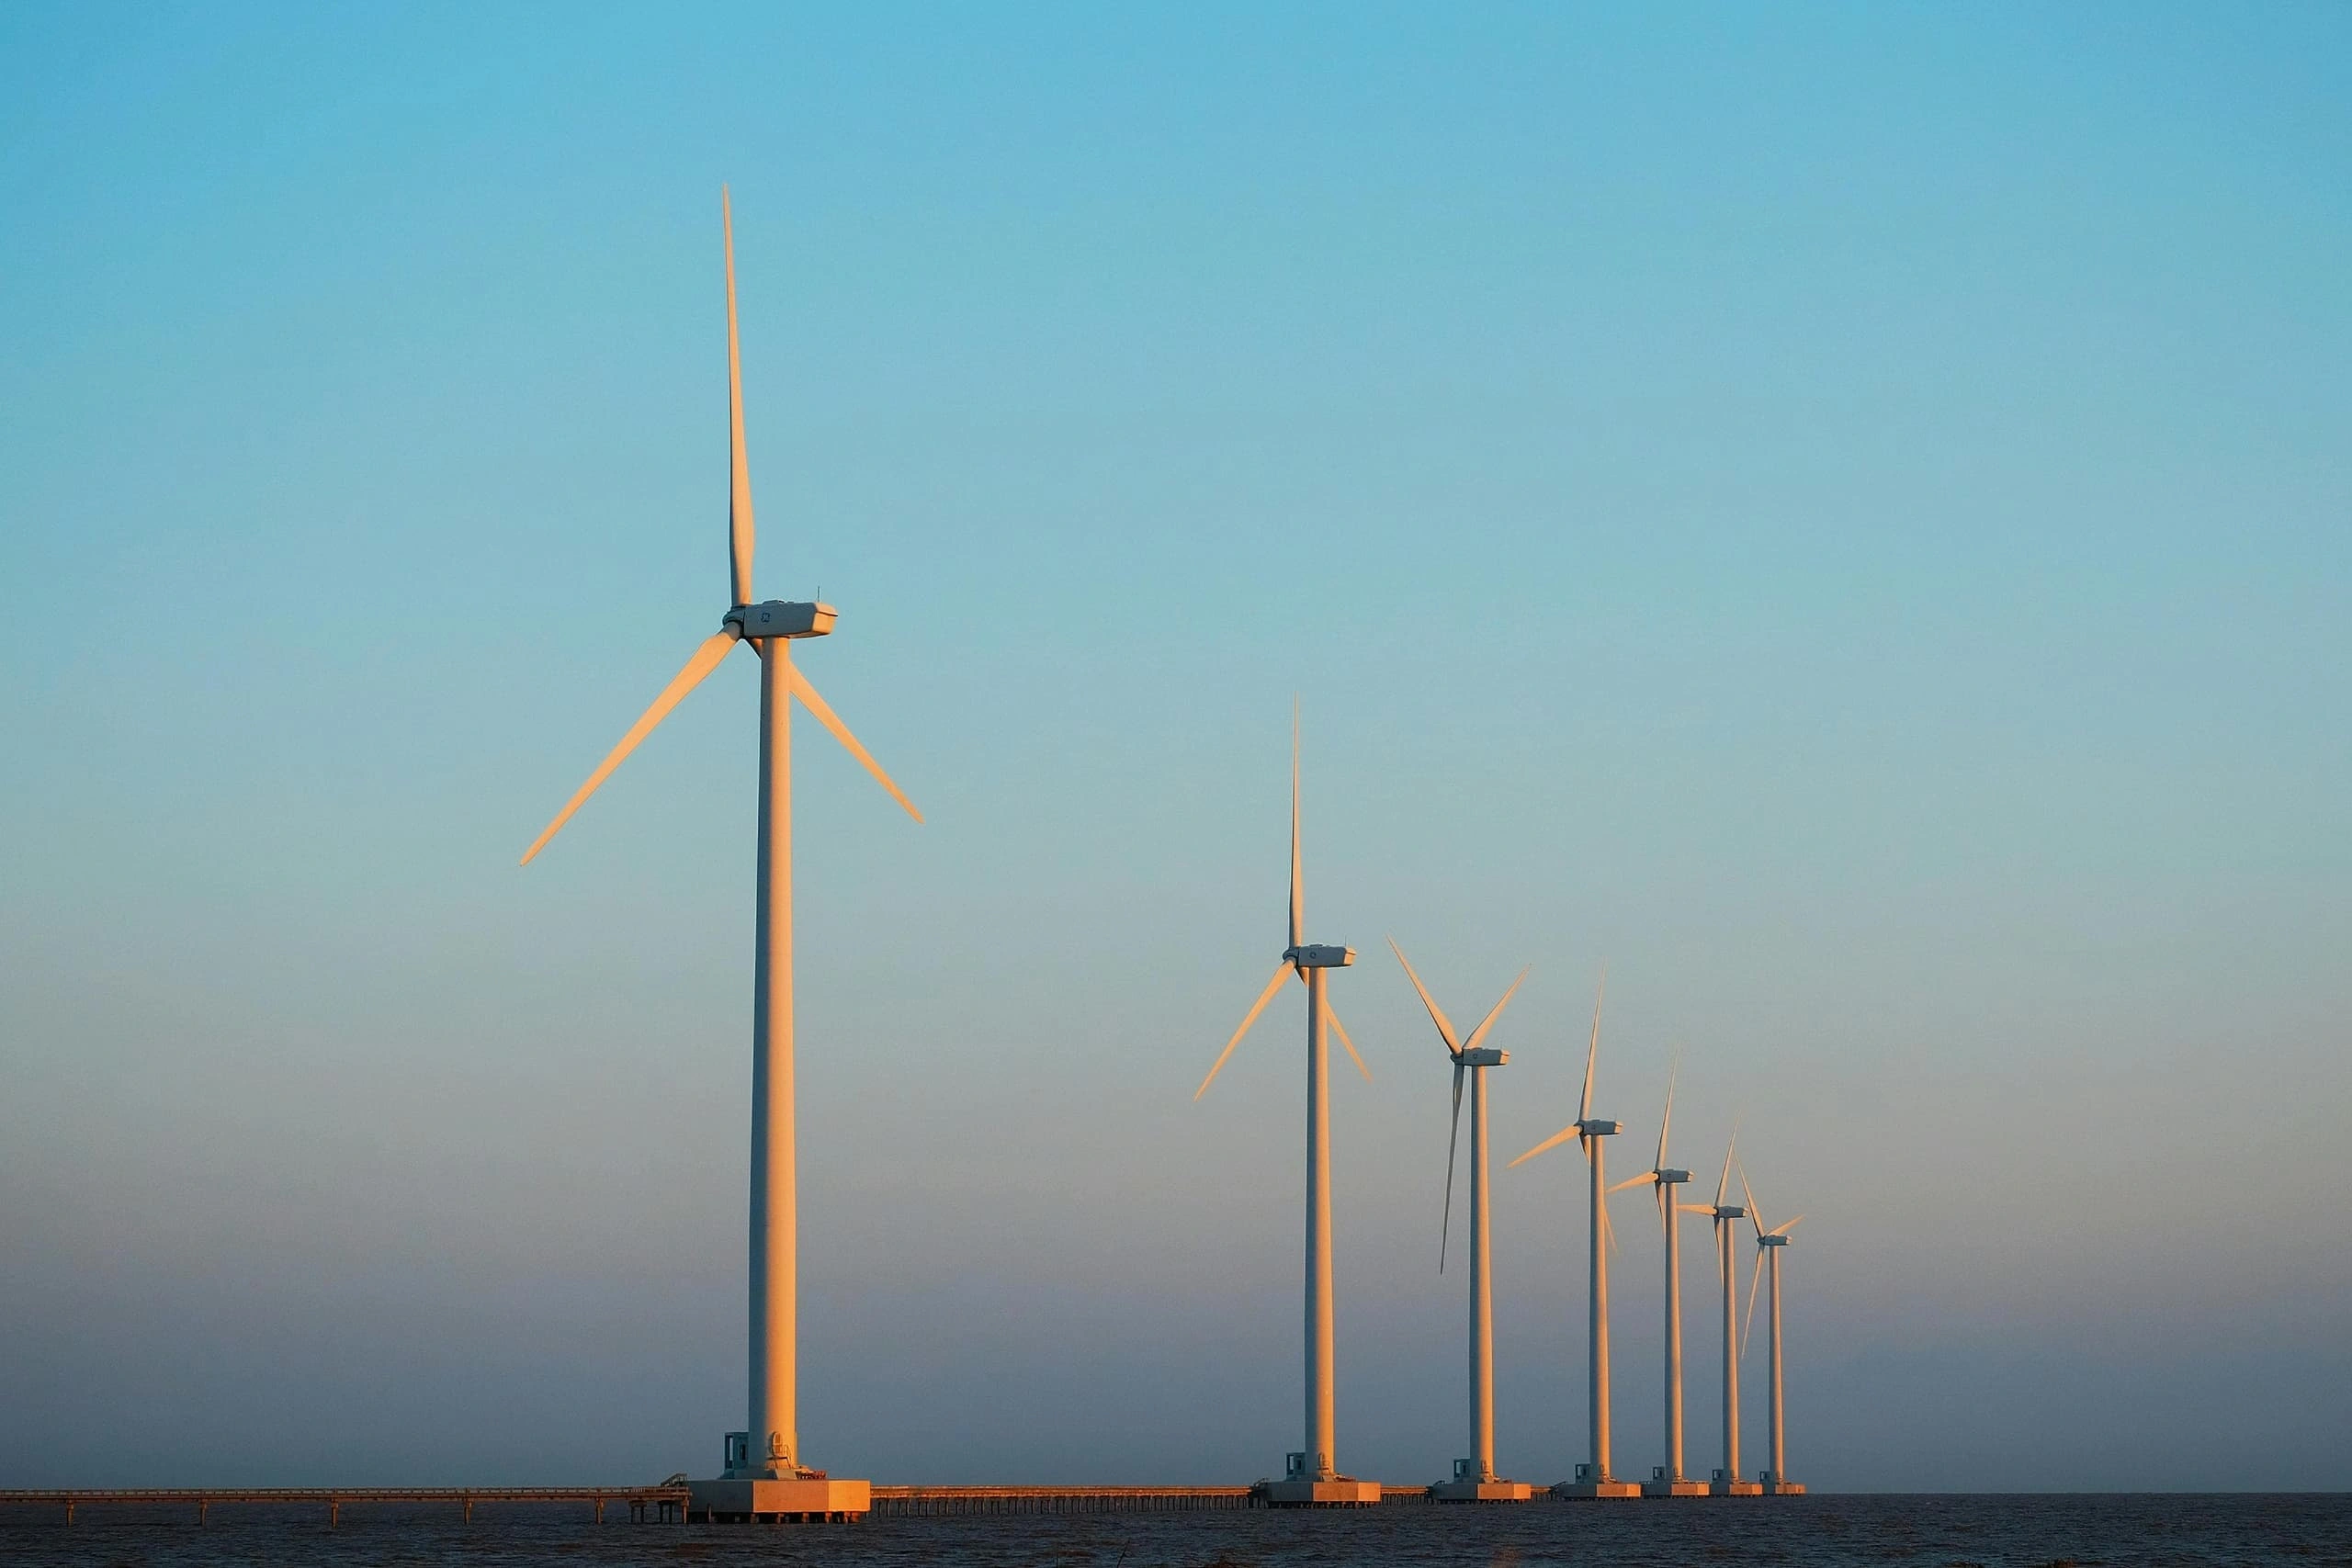
Solar and wind site suitability DEMs, construction progress monitoring, vegetation and snow cover analytics for generation assets.
Lifecycle
Generate, transmit, detect - one geospatial pipeline.
Three phases of the value chain. The same tasking pipeline serves each - from exploration and site selection through to transmission vegetation management and methane super-emitter detection.
01
Generate
Site selection, environmental baselines and wellpad / renewable activity monitoring - from exploration multispectral through to solar and wind DEM suitability.
- Wellpad activity & disturbance
- Solar & wind site DEMs
- Multispectral exploration archive
- Environmental baselines & ESG
02
Transmit
Pipeline right-of-way, LNG and storage terminal activity, transmission corridors and substations - captured through analysis-ready commercial optical on a schedule that matches the asset.
- Pipeline & right-of-way change detection
- Right-of-way vegetation & encroachment
- LNG, terminal & storage activity
- Transmission & substation change
03
Detect
Methane attribution, flare detection and oil spill response - satellite imagery pinpoints what is happening at the asset level, measures the extent and produces a timestamped spatial record operators and asset managers can act on.
- Methane plume attribution & quantification
- Thermal flare detection
- Oil spill incident response
- Timestamped disturbance & incident records
Wide-area visibility without constant site visits.
A single imagery pipeline connects wells, terminals, pipelines, transmission corridors and renewables - every asset, every cadence, one source of evidence.
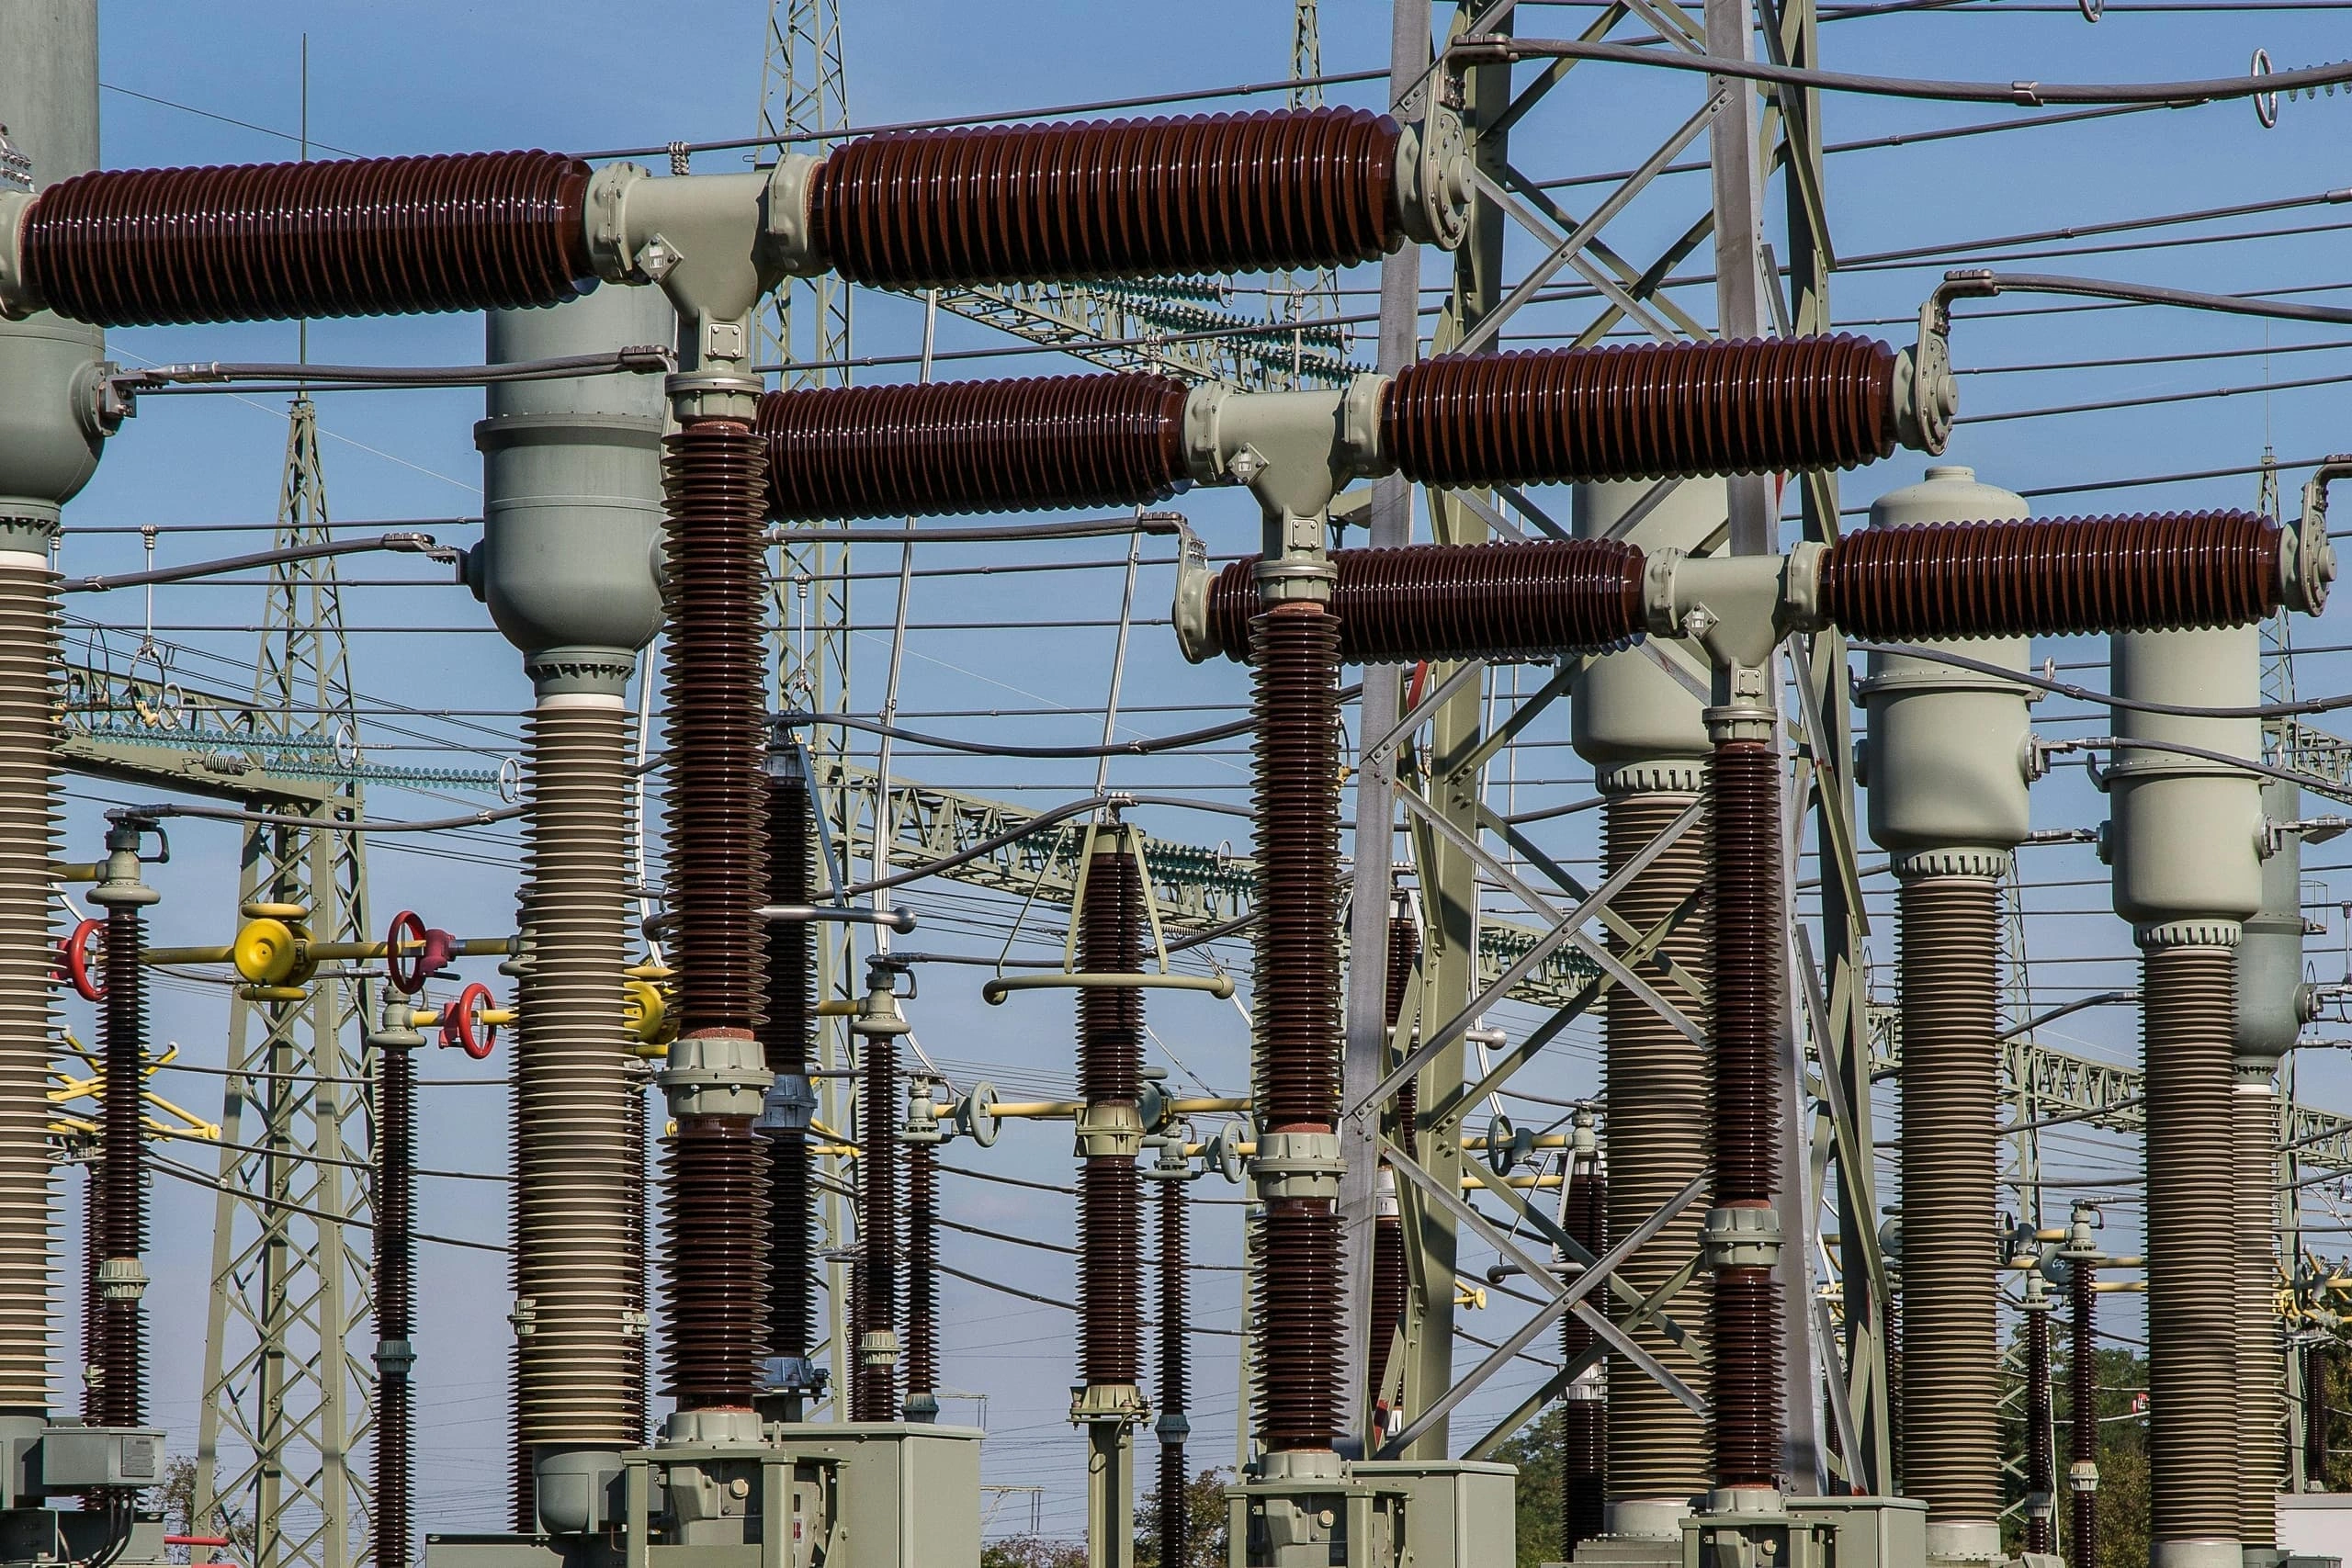
Transmission corridors, pipelines and renewable assets unified through one scheduled tasking pipeline.
In the field
Real captures across the value chain.
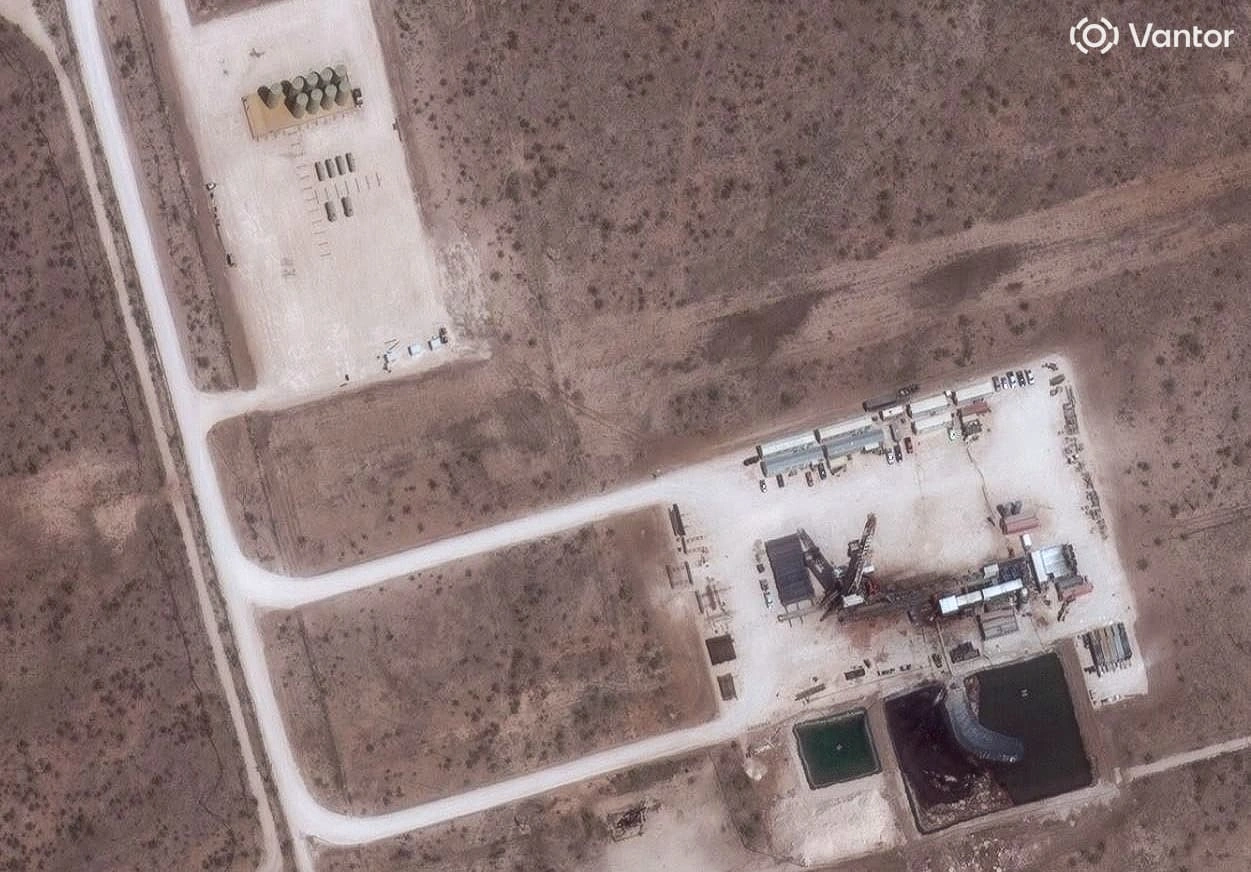
High-resolution optical · 3 Apr 2025
Upstream · Permian wellpad
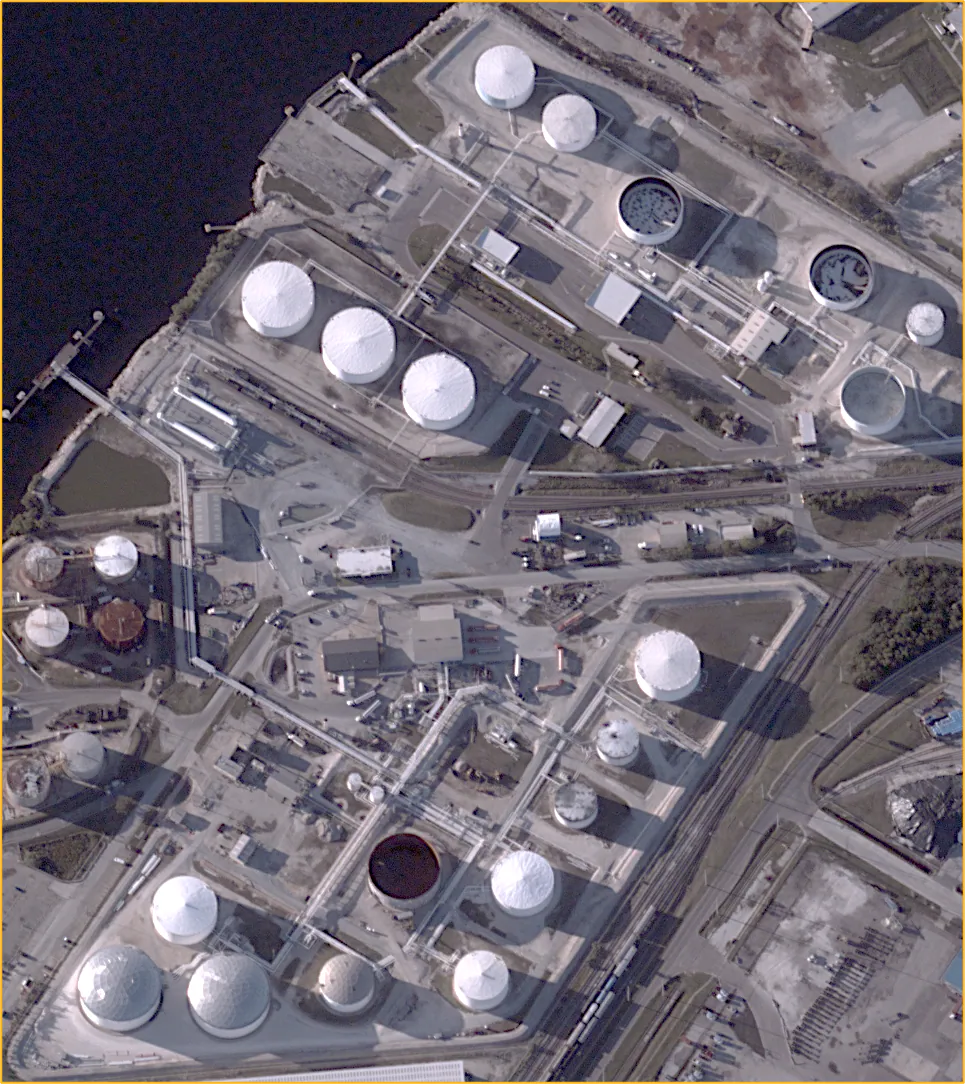
High-resolution optical · 7 Mar 2025
Midstream · Tampa oil terminal
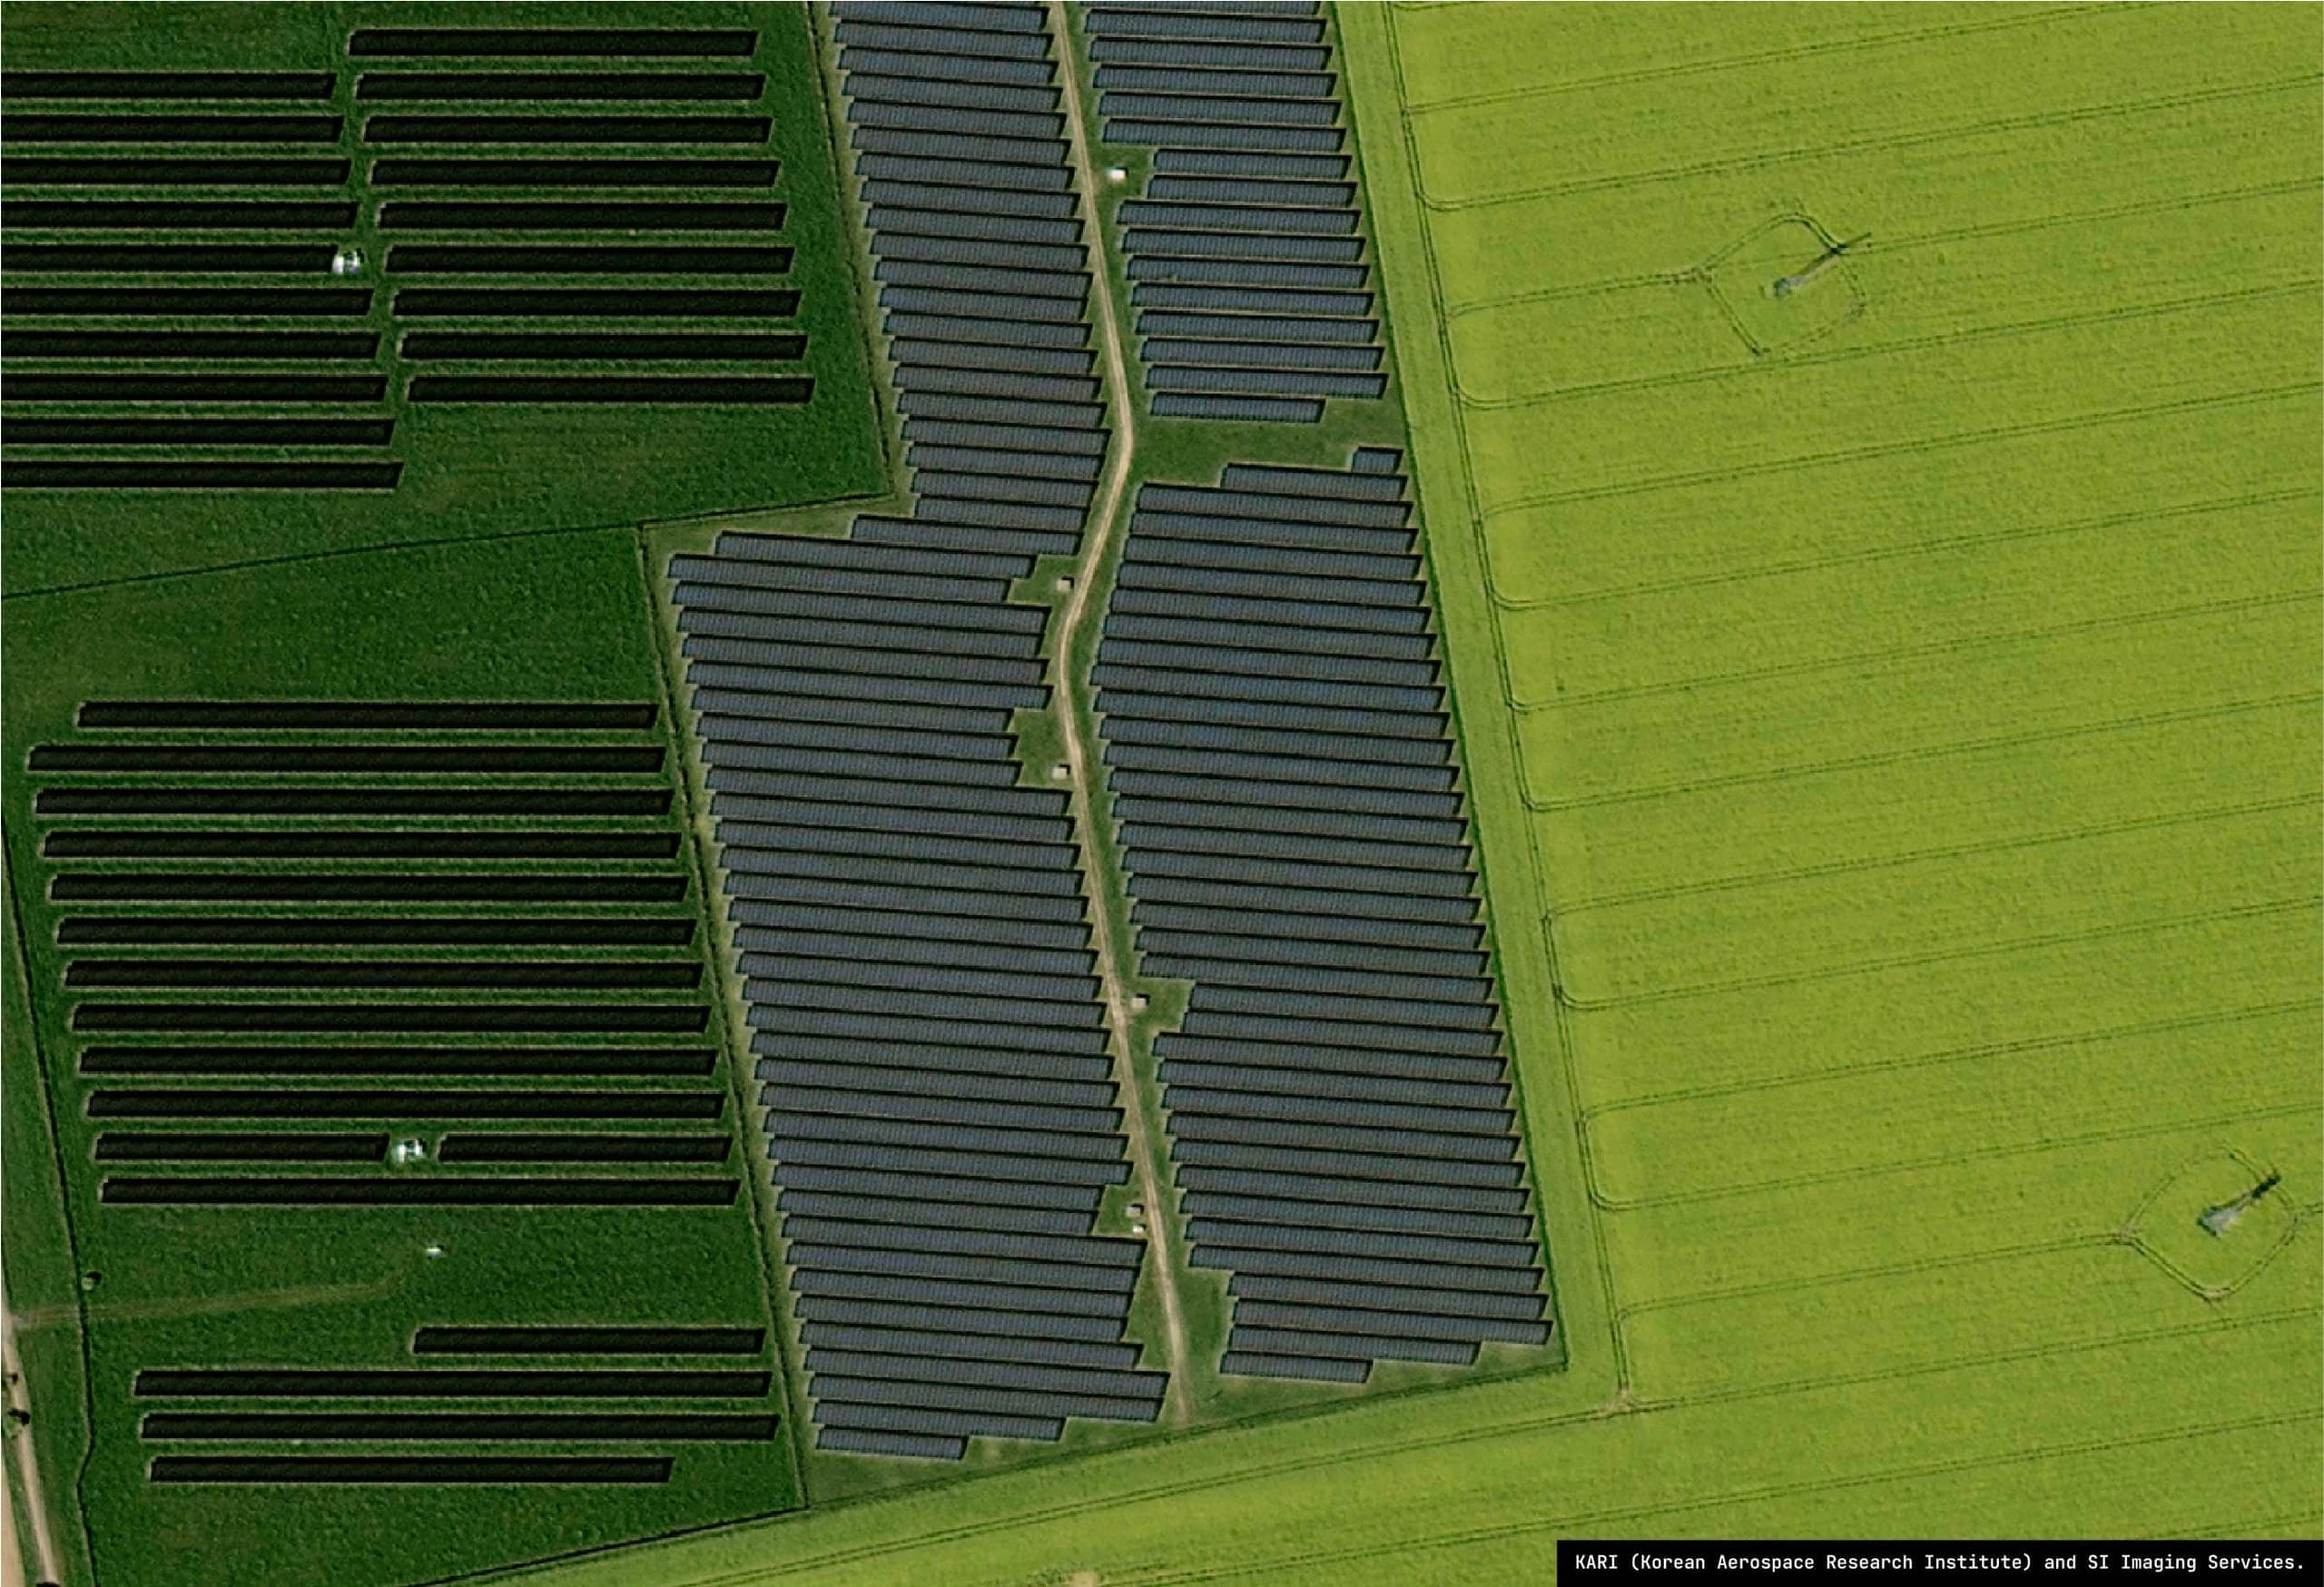
High-resolution optical
Renewables · utility solar farm
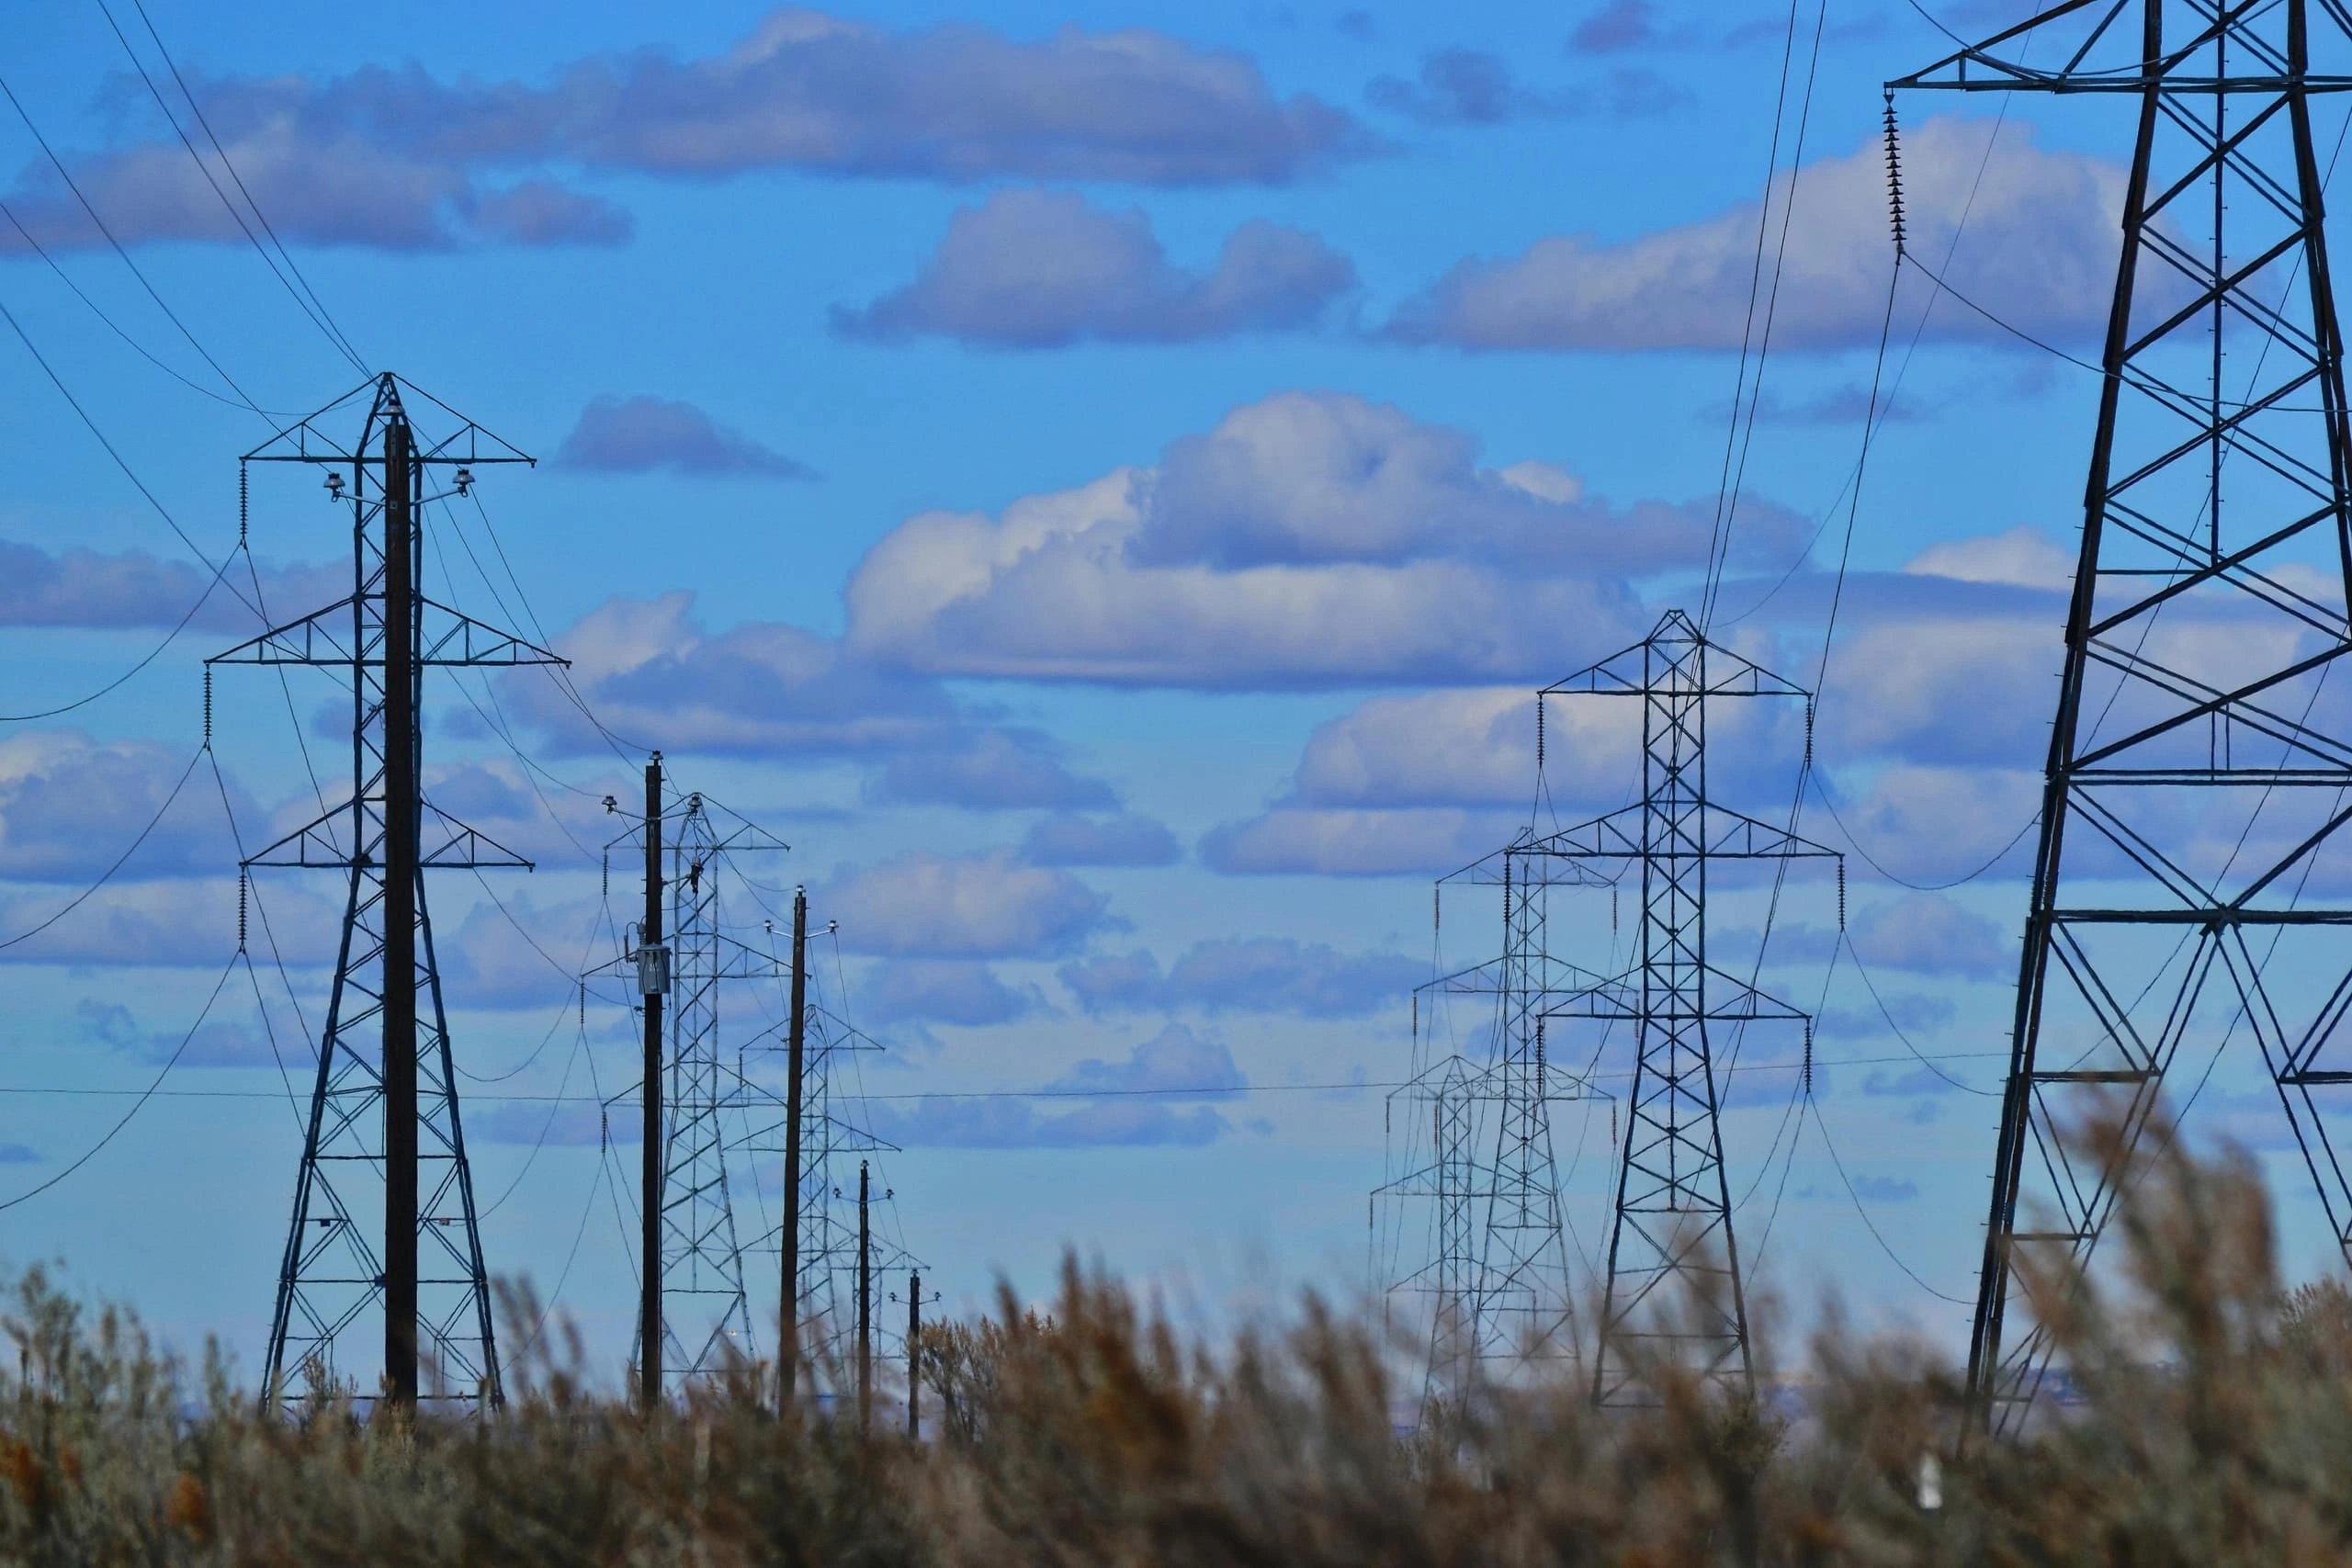
Capabilities
Capabilities across the energy portfolio
Pipeline integrity & right-of-way
Scheduled high-resolution imagery detects encroachment, third-party interference and construction along pipeline right-of-way without mobilising aerial flights. All-weather radar follows where geotechnical questions need ground-deformation measurement.
Transmission vegetation management
Vegetation indices and high-resolution imagery rank transmission, distribution and pipeline corridors by growth pressure, so crews go to the segments that need clearance most, not the ones next on the rotation - cutting outage risk and clearance cost per span.
Renewable site screening & monitoring
Stereo-derived elevation models support solar-radiation and wind-exposure analysis for site selection. Once built, the same imagery pipeline tracks construction progress, vegetation encroachment and post-event damage across fossil and renewable portfolios.
Oil spill & incident response
High-resolution optical tasked within hours of an incident, with all-weather radar for cloud-blocked or night-time scenes. Independent, timestamped evidence for operators, regulators and insurers in the first 24 hours.
Where energy monitoring falls behind
Super-emitter blind spots
High-emission methane events go undetected between ground survey cycles, so operators learn about them after the fact, not while there is time to act.
Reactive pipeline integrity
Ground movement along pipelines is caught by field teams after the fact, not during the weeks it develops.
Vegetation-driven outages
Vegetation outages persist because crews are routed by the calendar, not by which spans carry the most risk.
Fragmented spatial evidence
Methane, vegetation and disturbance data live in different systems, so there is no single record to turn to when questions arise.
Evidence aligned to the value chain.
The problem
Energy operators juggle methane reporting, pipeline integrity, vegetation management and renewable screening, each on its own inspection schedule, with evidence that rarely reconciles between regulator, board and field team.
The Terrabit approach
Terrabit delivers analysis-ready imagery, elevation models and analytics across the full value chain, so you can see what is happening at every asset, measure change over time and act on one consistent spatial record.
Data & methods
Analysis-ready imagery, elevation, and specialised data.
Imagery & analysis-ready processing
- Optical & multispectral · 30 – 50cm panchromatic and 4 – 8 band multispectral for asset-level detail and corridor vegetation
- Colour balancing · radiometric harmonisation across captures so the imagery reads consistently scene-to-scene
- Orthorectification to control · sub-pixel geometric accuracy from ground control - imagery snaps to your existing layers
- Pansharpening & mosaicking · panchromatic fused with multispectral colour, then mosaicked into seamless area coverage
- Atmospheric correction (ATCOR) · surface-reflectance products with cloud and shadow masks - ready for indices and analytics
Elevation & 3D
- Stereo & tri-stereo · Native digital surface model (DSM) generation for solar, wind and corridor design
- DEM, DSM & DTM · Digital surface (DSM) and digital terrain (DTM) models at 0.5 – 5m resolution for renewable site screening and route planning
- Solar & wind analysis · Slope, aspect, shading and exposure surfaces from stereo DEMs
- 3D corridor support · Pipeline and transmission route design, drainage and flood layers
- Cadence · Project-phase or on-demand post-incident
Specialised data & delivery
- Synthetic aperture radar (SAR) · All-weather radar for cloud-blocked, night-time or incident response coverage
- Delivery formats · Cloud-Optimized GeoTIFF (COG), GeoPackage, SpatioTemporal Asset Catalog (STAC), time-series CSV or custom formats to fit your workflow
- Integration · ArcGIS, QGIS, Mapbox, Databricks, Snowflake, S3 and Albatross - no conversion step
How it works
From question to delivered product in one pipeline.
Same pipeline, same provenance - every asset, every sub-sector.
Define your area & question
Upload a shapefile, KML or GeoJSON for your field, corridor or portfolio and tell us the question - pipeline integrity, vegetation risk, solar screening, methane attribution. We match sensors, cadence and processing to it.Task or pull from archive
Our team searches archives across 20+ constellations and tasks the right sensor on the right day. You approve the plan and budget in one step - no procurement loop.Process to analysis-ready products
Captures are orthorectified, corrected and pansharpened into analysis-ready imagery. From there we derive vegetation risk rankings, change polygons, methane plumes and thermal anomalies.Deliver to your stack
Products land directly in ArcGIS, QGIS, Databricks, Snowflake, S3 or Albatross, in the formats your platform expects - timestamped, attributable and audit-ready, with no conversion step.
Outputs
Delivered across the portfolio.
Concrete products energy operators receive across upstream, midstream, transmission and renewables - not abstract capabilities.
Upstream & exploration
- Wellpad activity & disturbance reports
- Multispectral exploration archive
- Drill-site baseline & rehabilitation
- Frontier basin tenure maps
- Water & vegetation ESG indicators
- Historical imagery compilation
Midstream & transport
- Pipeline & right-of-way change detection
- Encroachment & disturbance alerts
- LNG & terminal activity packs
- Storage tank level & turnover
- Vessel activity at terminals
- Corridor DEMs & 3D derivatives
Transmission & distribution
- Vegetation risk-ranking archives
- Tower, pole & substation change
- Corridor monitoring & ground baselines
- Outage-risk vegetation polygons
- Network-wide base-map refresh
- Post-event damage assessment
Renewables & ESG
- Solar & wind site suitability DEMs
- Panel utilisation and integrity
- DEM for high level flood risk and drainage
- Construction progress & disturbance
- Methane attribution & disturbance evidence
Platform
One tasking pipeline, every asset.
Coordinate imagery, elevation and specialised data tasking across every asset, with centralised budgets, multi-team access and audit-ready archives.
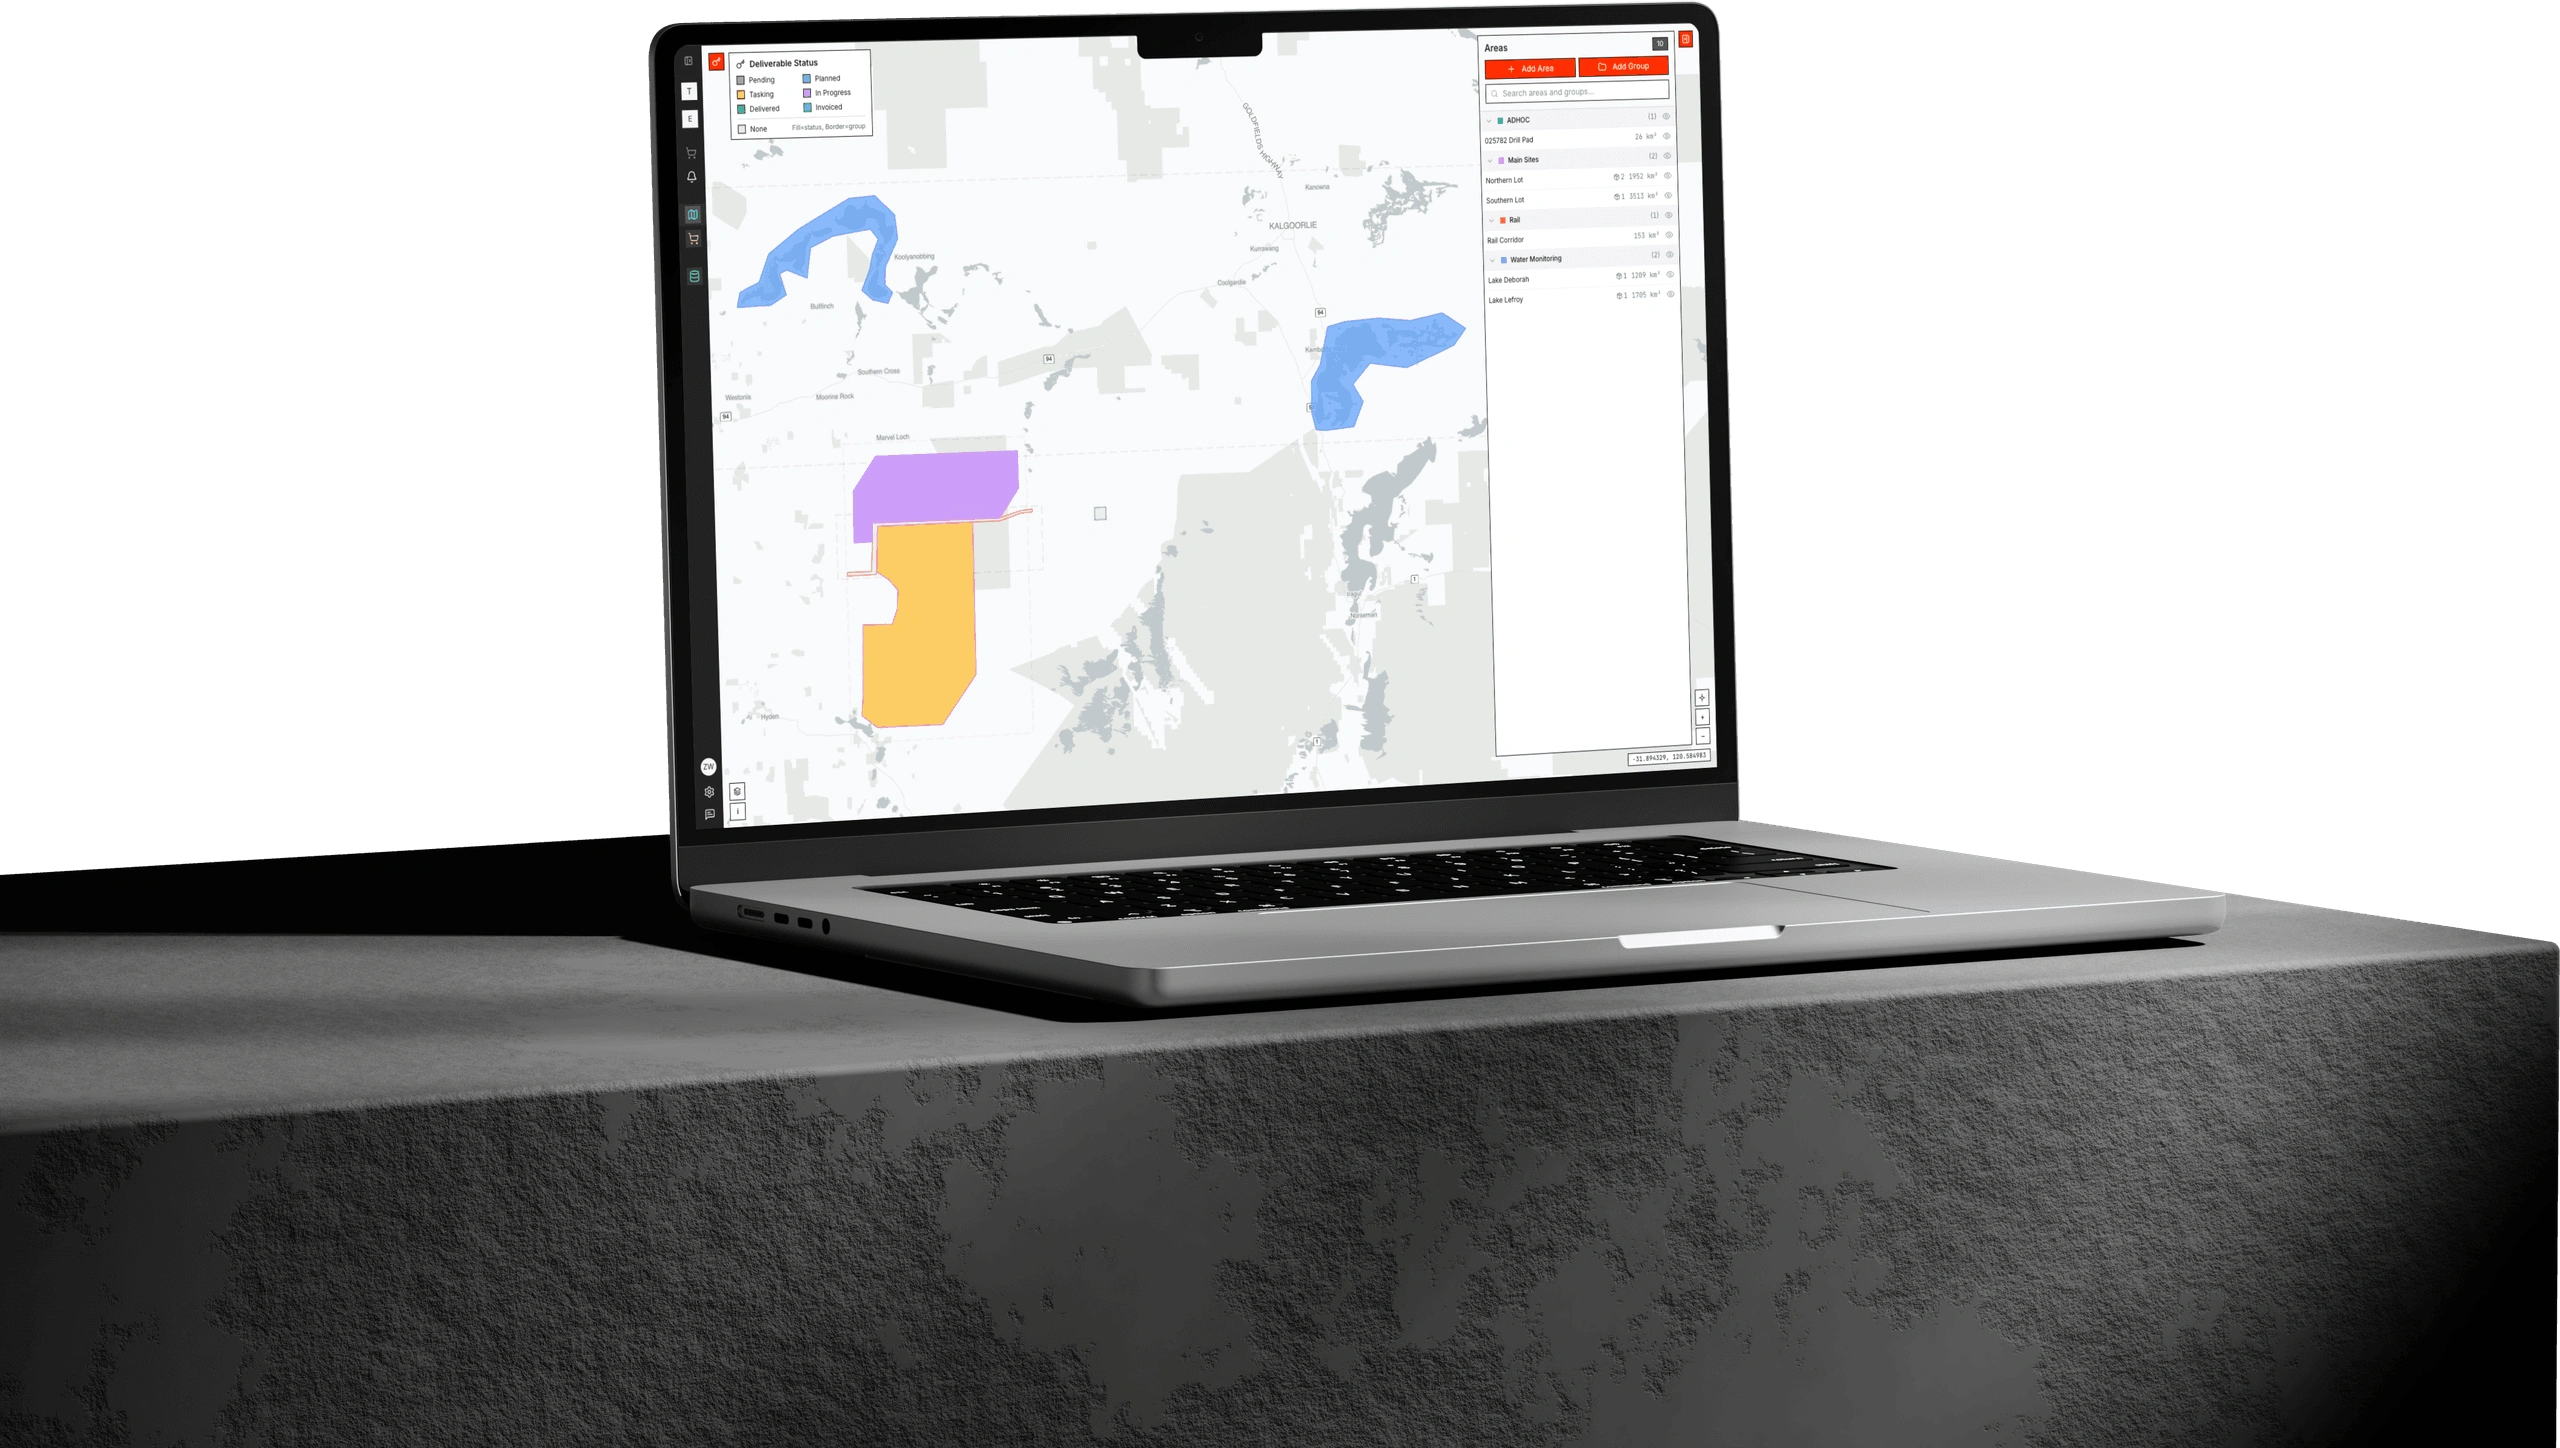

Albatross is where your whole portfolio orders and manages satellite data. Submit tasking, approve budgets, track deliveries and keep a spatial record of every asset, from wellpads and pipelines to transmission corridors and renewables.
Products
The data products behind the page.
Products
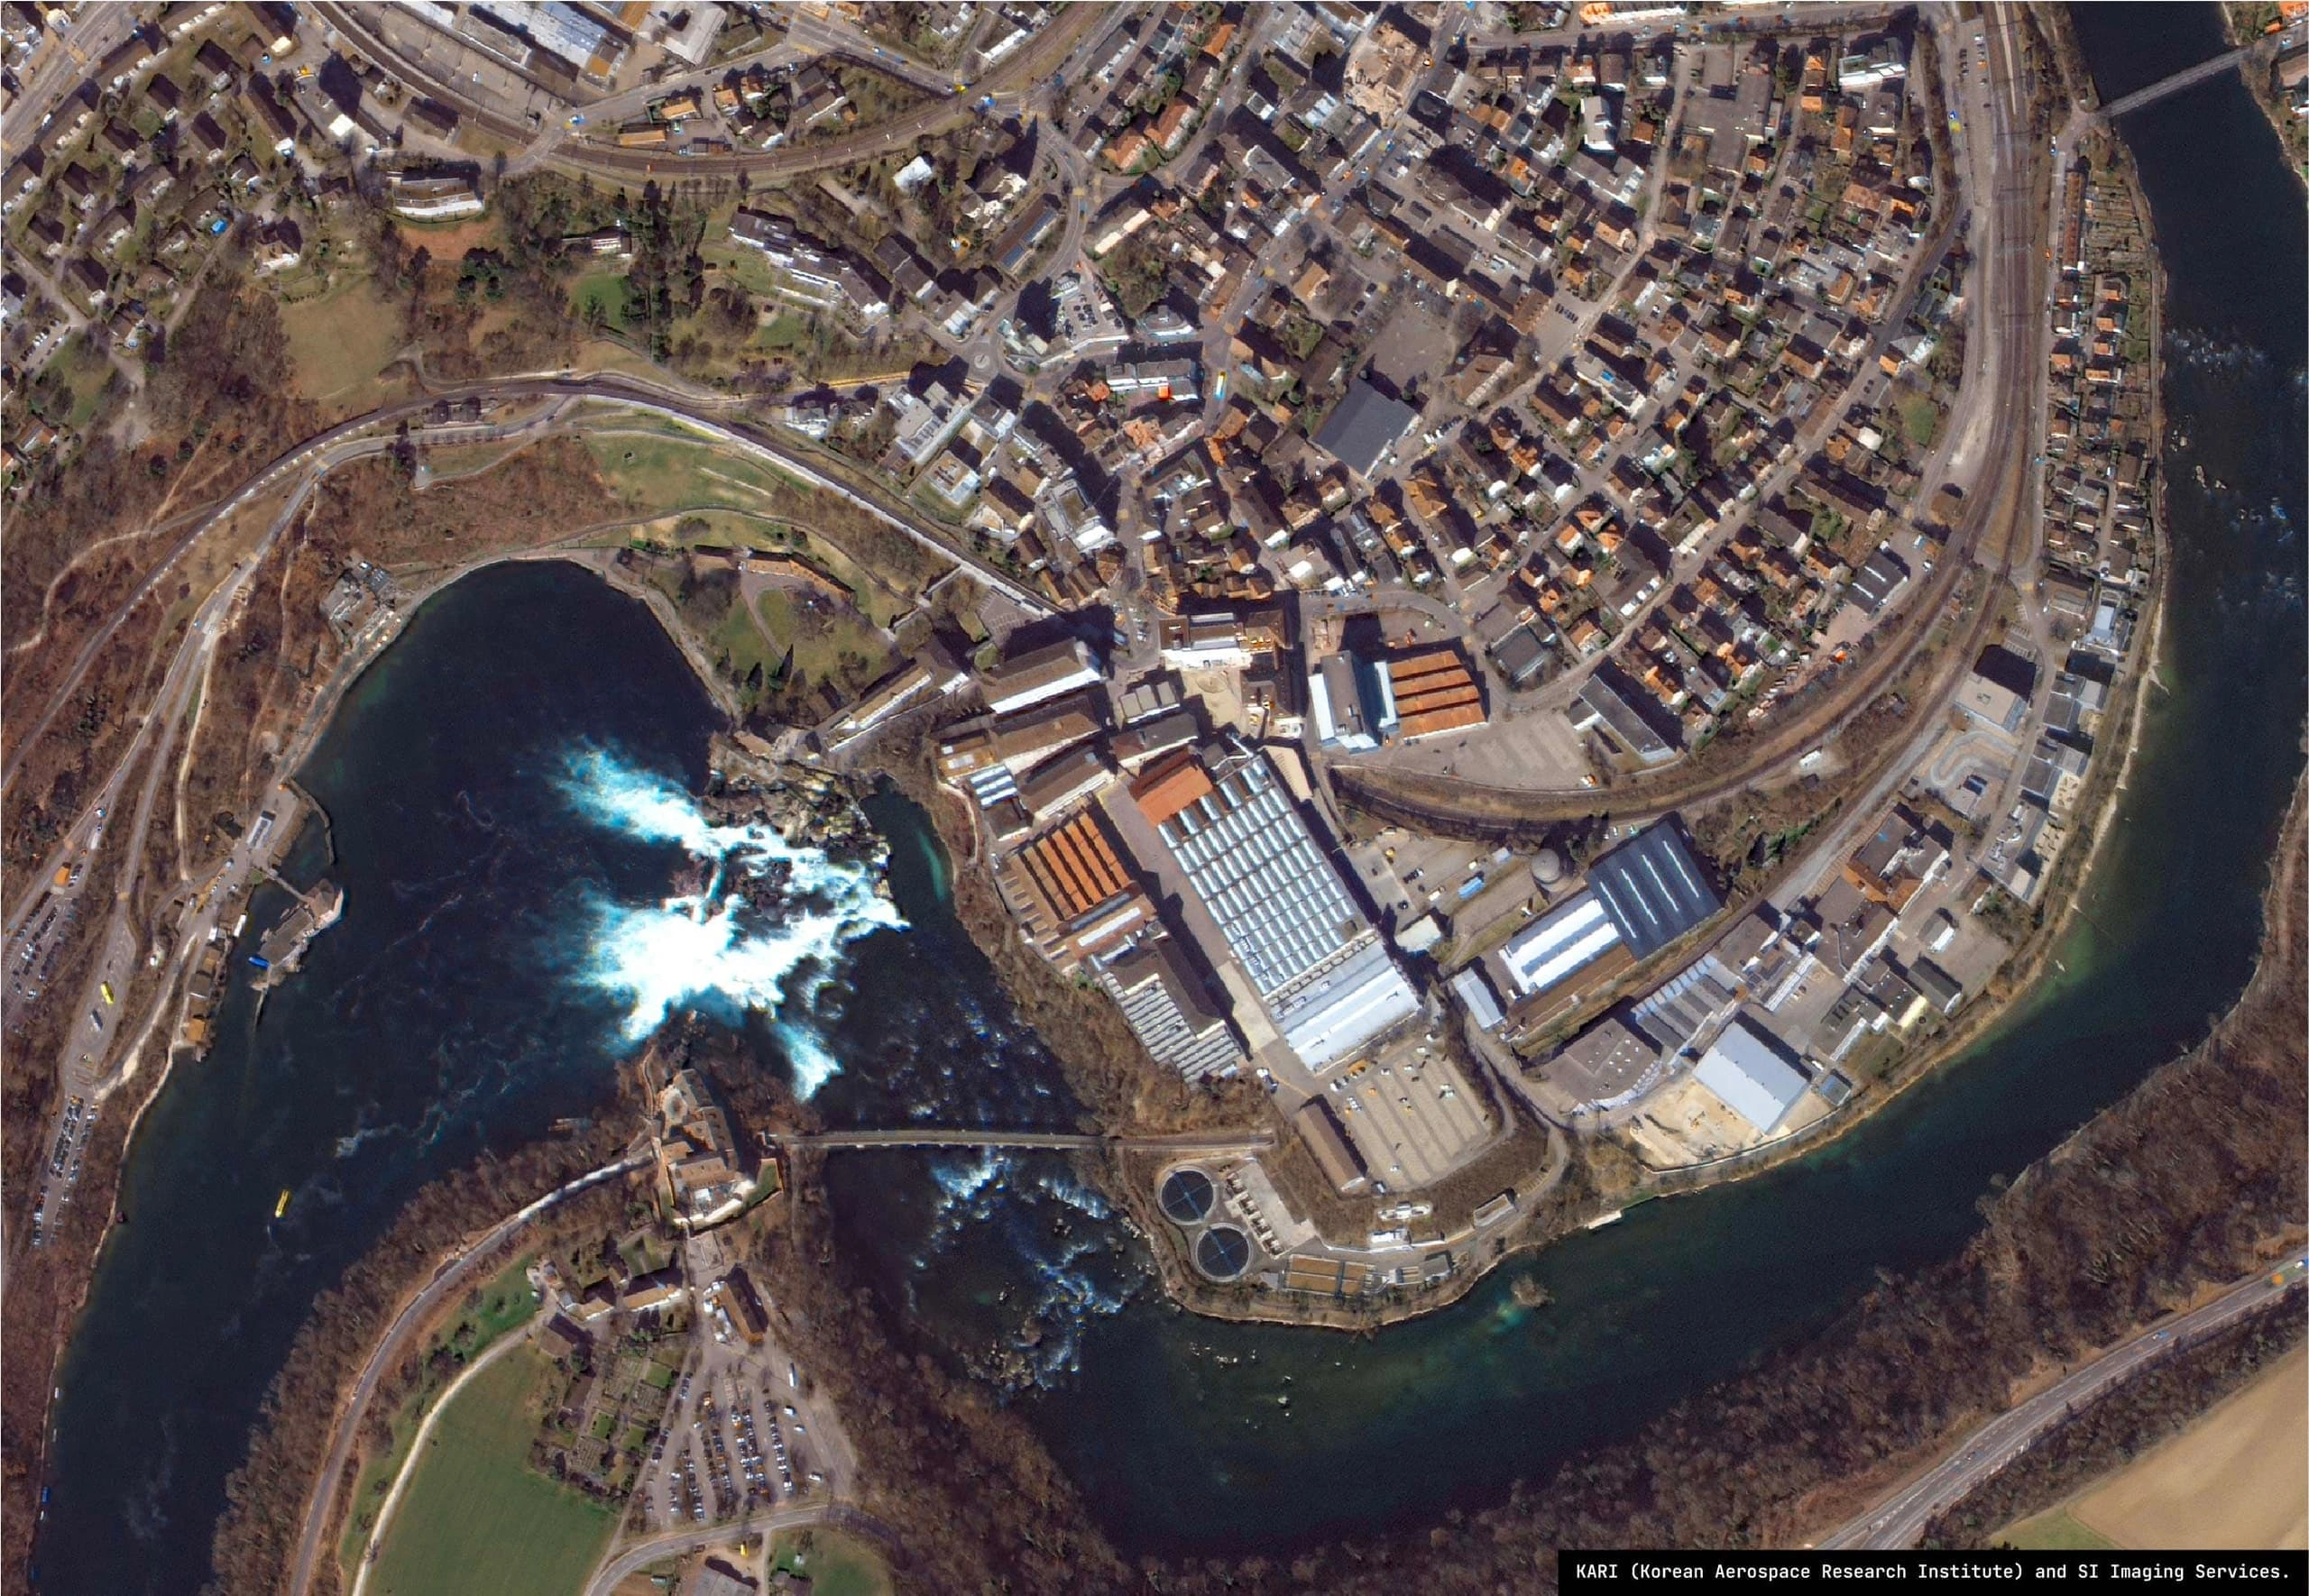
Satellite Imagery
Analysis-ready optical and multispectral commercial imagery - colour-balanced, orthorectified, pansharpened and atmospherically corrected - for pipeline integrity, vegetation management, renewable site monitoring.
Products
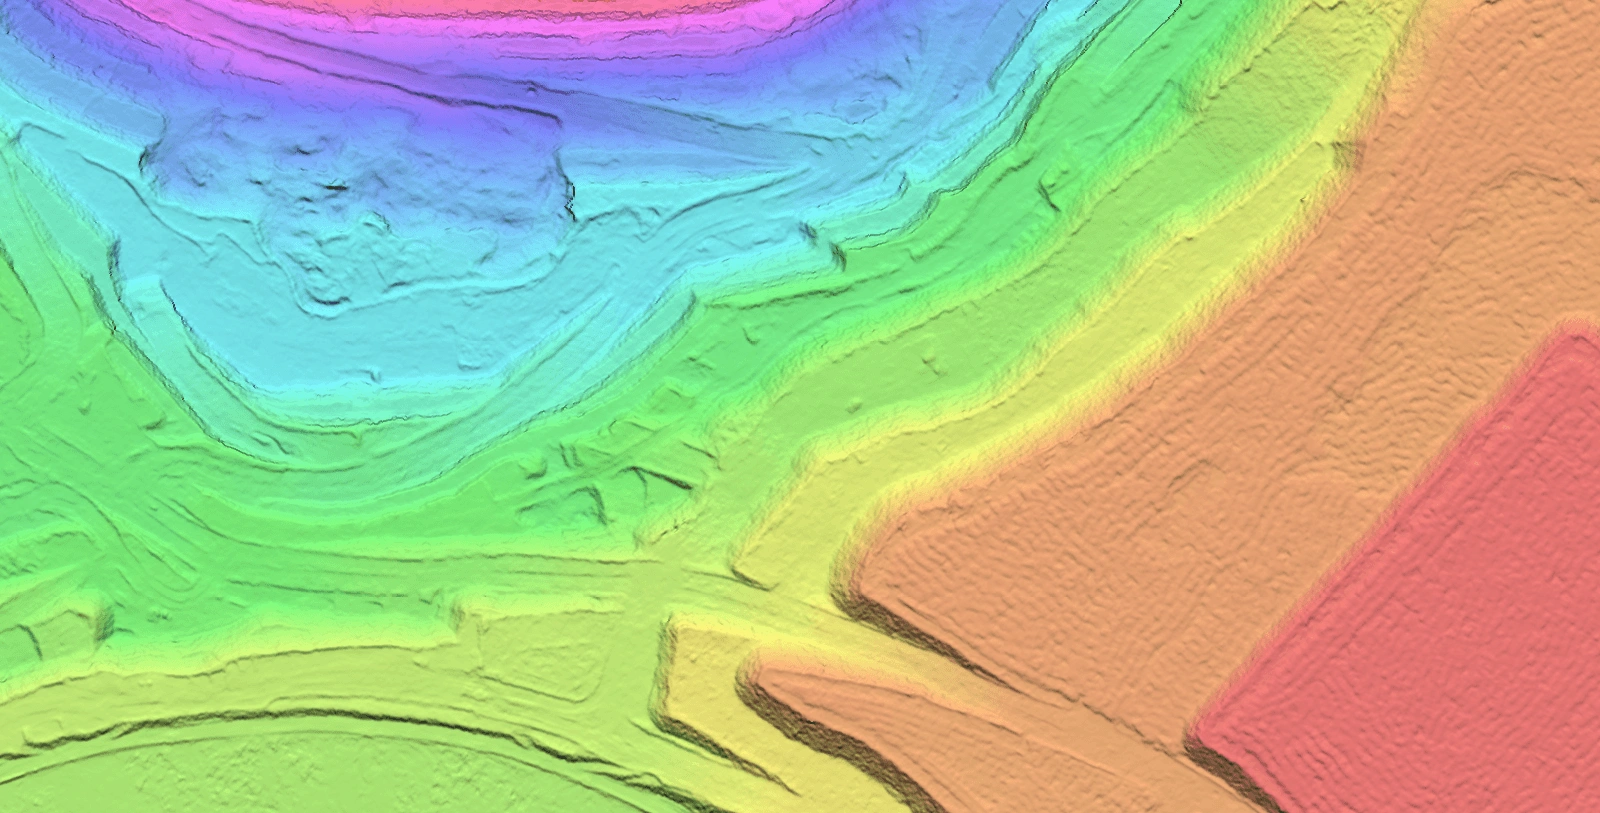
Digital Elevation Models
DEM, DSM and DTM products from 0.5m to 5m resolution for solar and wind site screening, transmission route design, pipeline corridor planning and dam baselines.
See what's changing across your energy portfolio
Talk to the team about imagery, elevation and analytics for your assets, from pipeline integrity and vegetation risk to methane detection and site screening.