Solutions / Industries / Environmental
Satellite evidence from baseline to verified outcome.
The problem
Environmental teams and carbon developers stitch evidence together from field plots, drone flights and fragmented open data - accurate at a point, uneven across time, and expensive to defend when a regulator, auditor or buyer questions the outcome.
Terrabit delivers analysis-ready imagery, vegetation indices and elevation models through one pipeline, so your team can see what's changing, measure it consistently and build a spatial record you can stand behind.
Who it's for
Built for carbon developers, environmental consultants and land managers.
Six ways satellite imagery works across environmental projects, from vegetation change and coastal shift to post-fire recovery.
Carbon & vegetation
Map vegetation cover, estimate biomass and track land-use change across your project area. Multi-date imagery shows what was there, what changed and how much has recovered.
Deforestation monitoring
Detect clearing and track forest-cover change at plot scale with cloud-free optical time series, packaged as chain-of-custody outputs for coffee, cocoa, palm oil, beef, soy, rubber and timber supply chains.
Biodiversity & habitat
Map habitat extent and condition from orbit. Imagery and vegetation indices reveal structure, land-cover change and ecosystem health across areas too large or remote for fieldwork alone.
Water & catchments
Track wetland extent, reservoir levels and early algal blooms - a consistent view of the whole catchment between field visits.
Coastal & blue carbon
Shoreline change, mangrove extent and seagrass monitoring for blue-carbon projects across Australian and Pacific coasts, aligned to DEA Coastlines.
Fire & restoration
Fire-scar time series, burn severity and revegetation tracking, supporting savanna fire management, mine rehabilitation and environmental plantings.
In the field
Real captures across ecosystems.
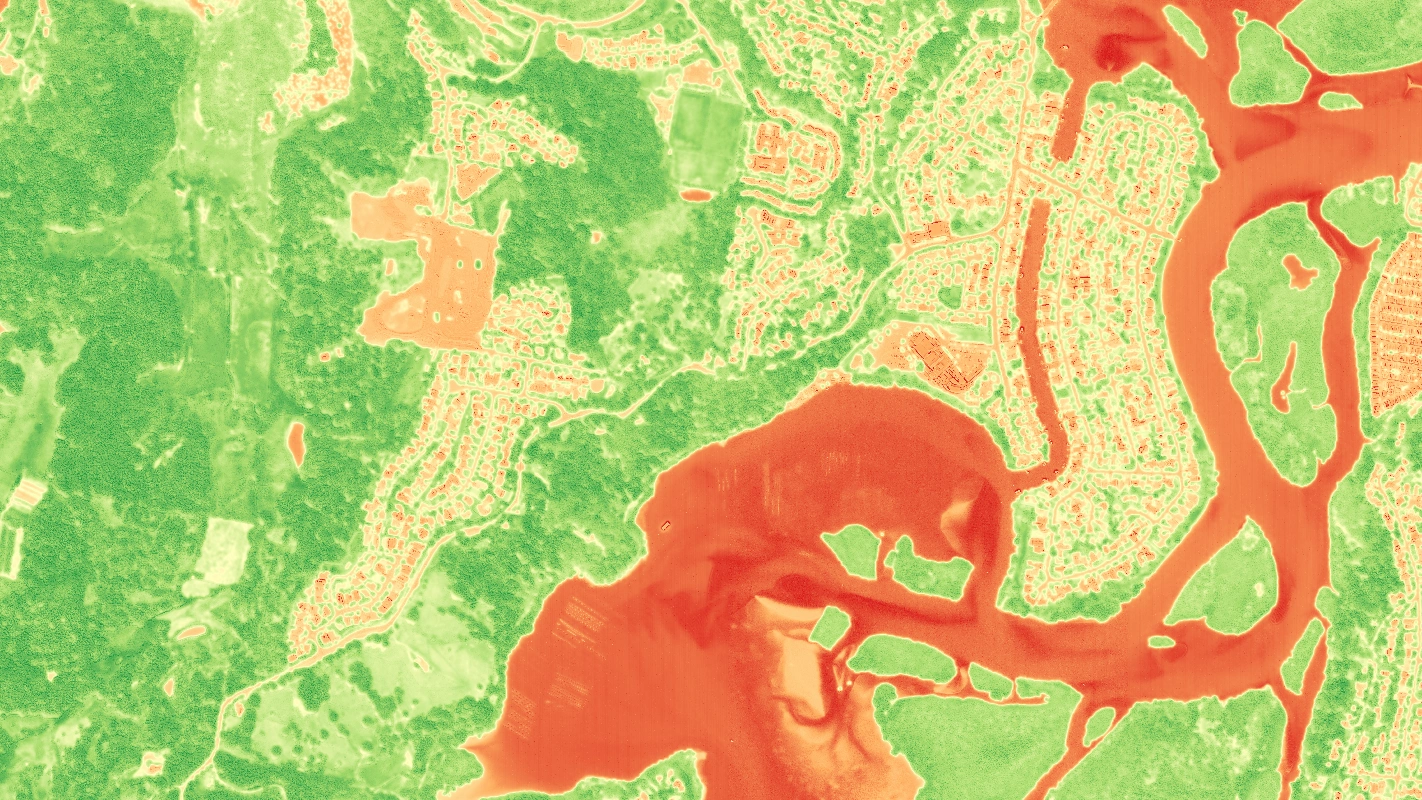
NDVI · WorldView Legion
NDVI · vegetation health, Tweed NSW
High-resolution optical · 28 Oct 2025
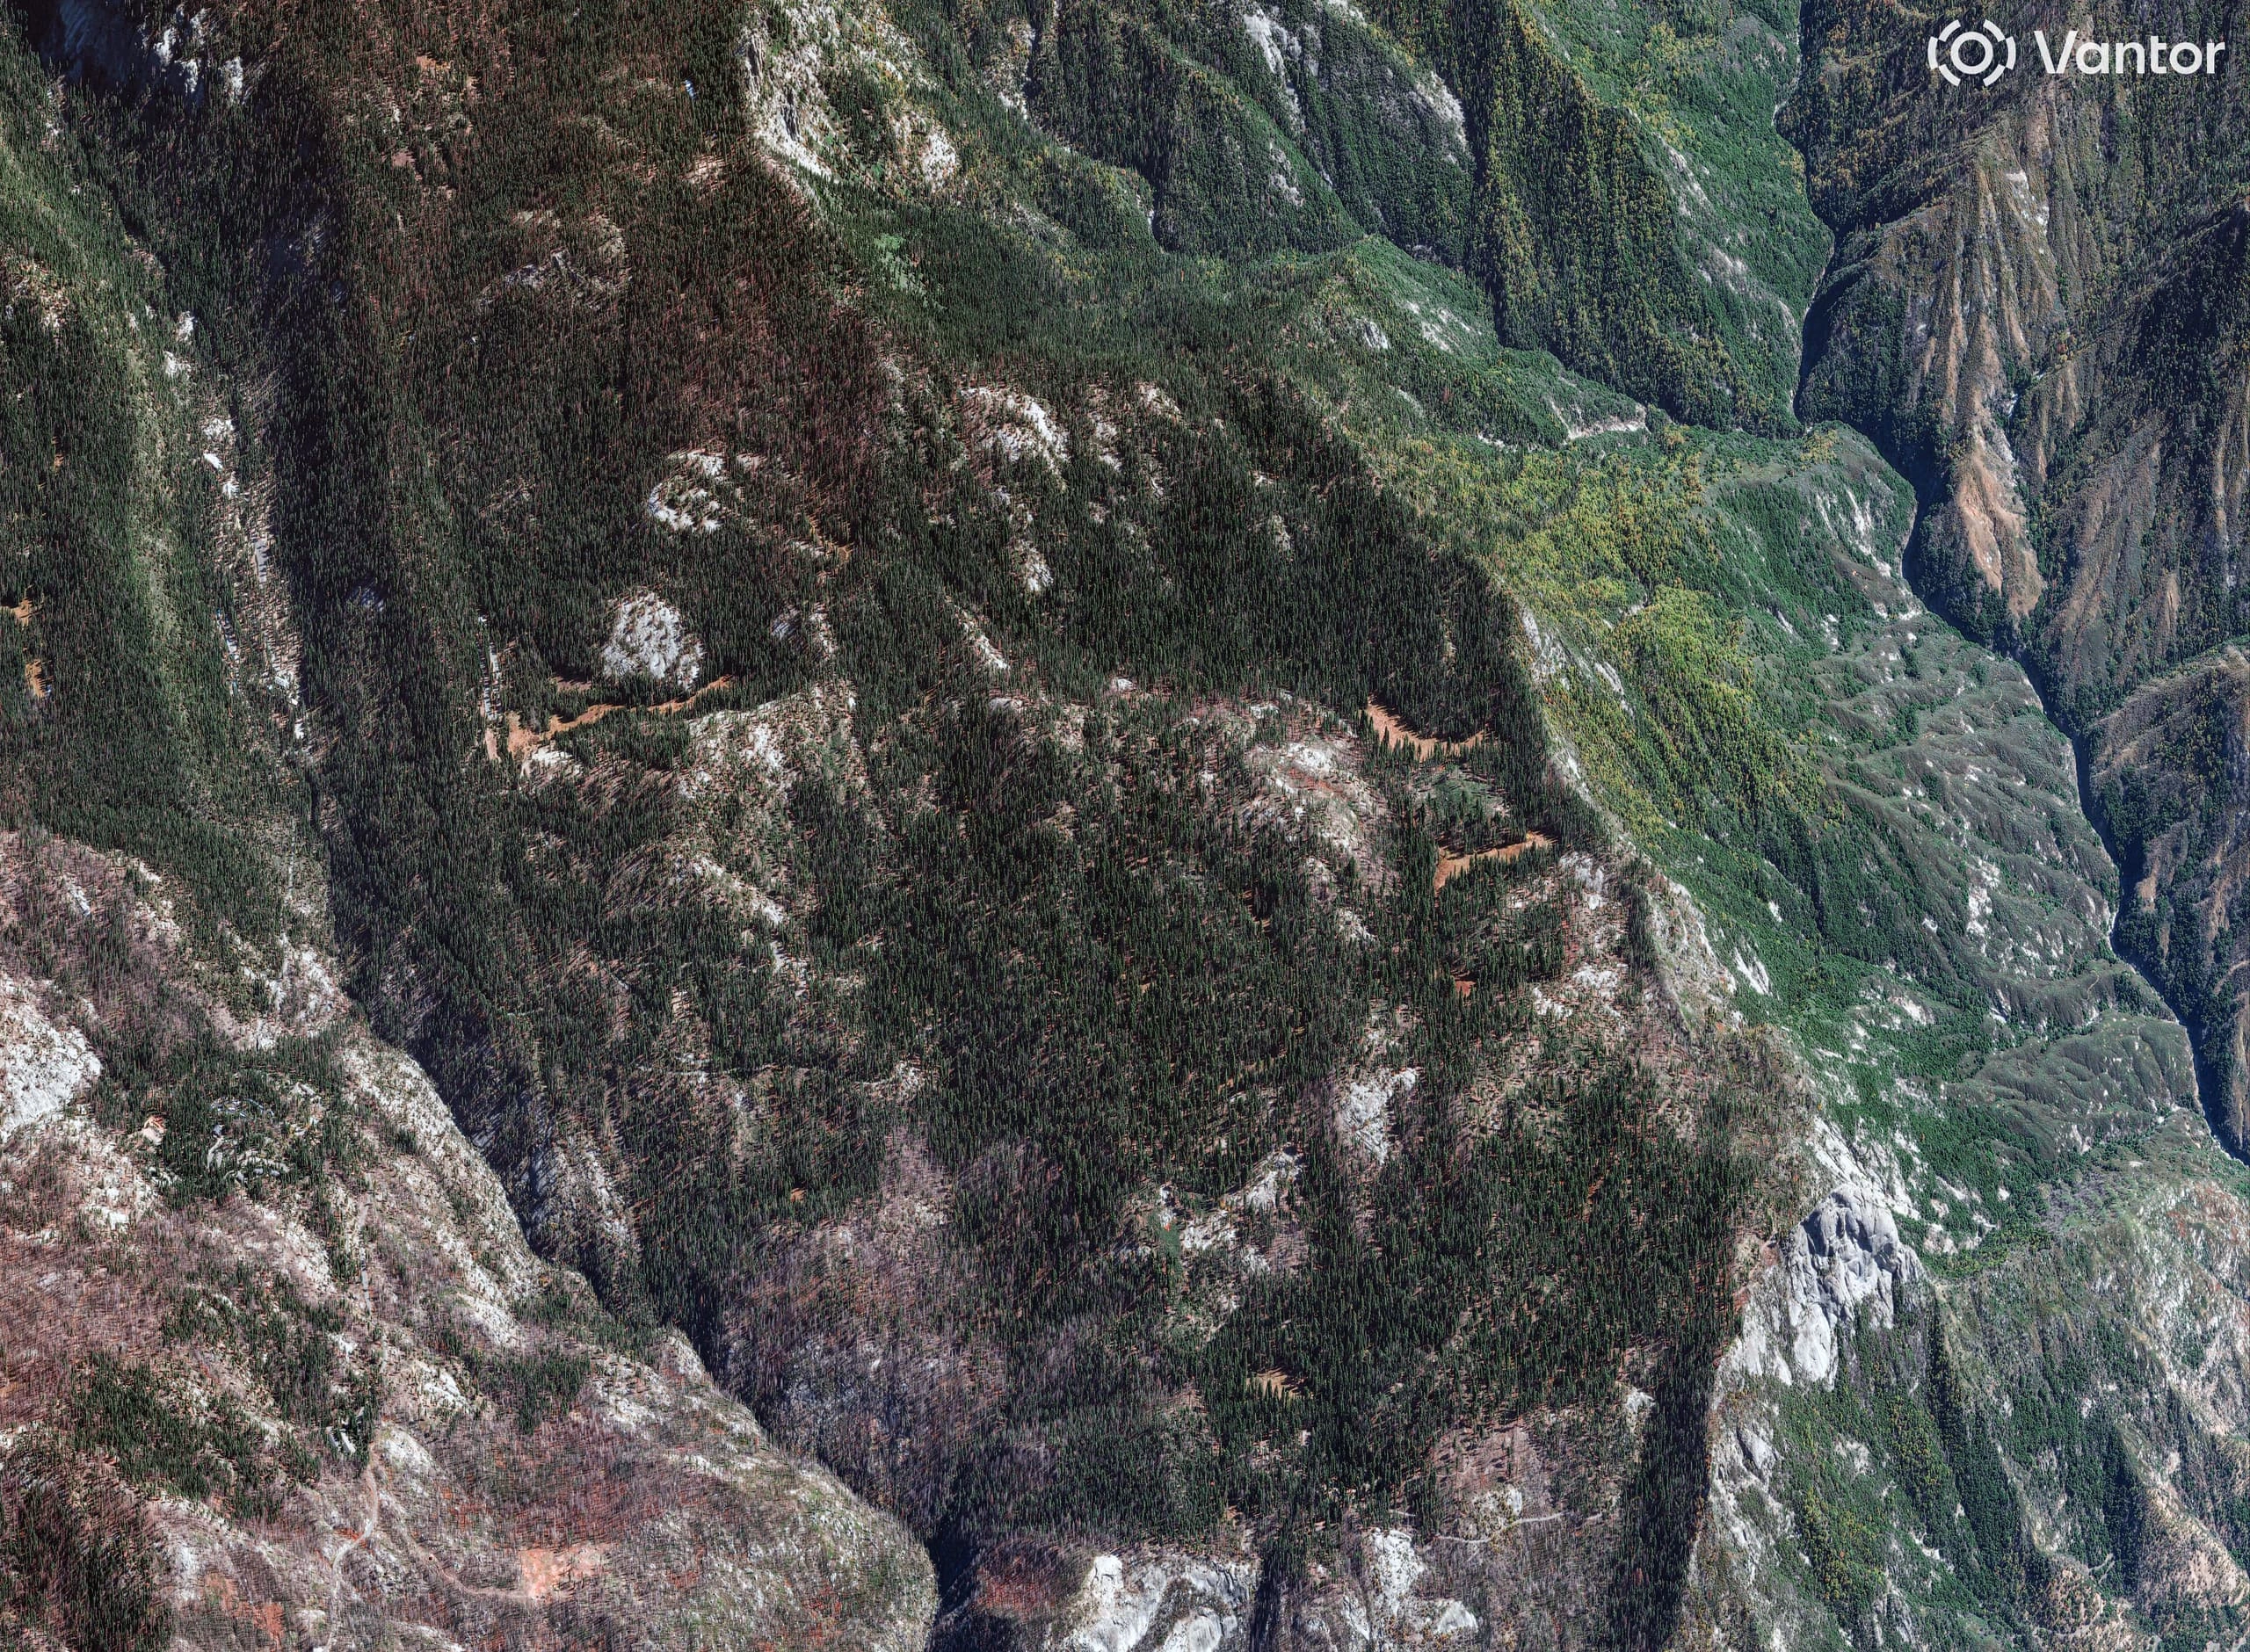
Forest canopy · Giant Forest, US
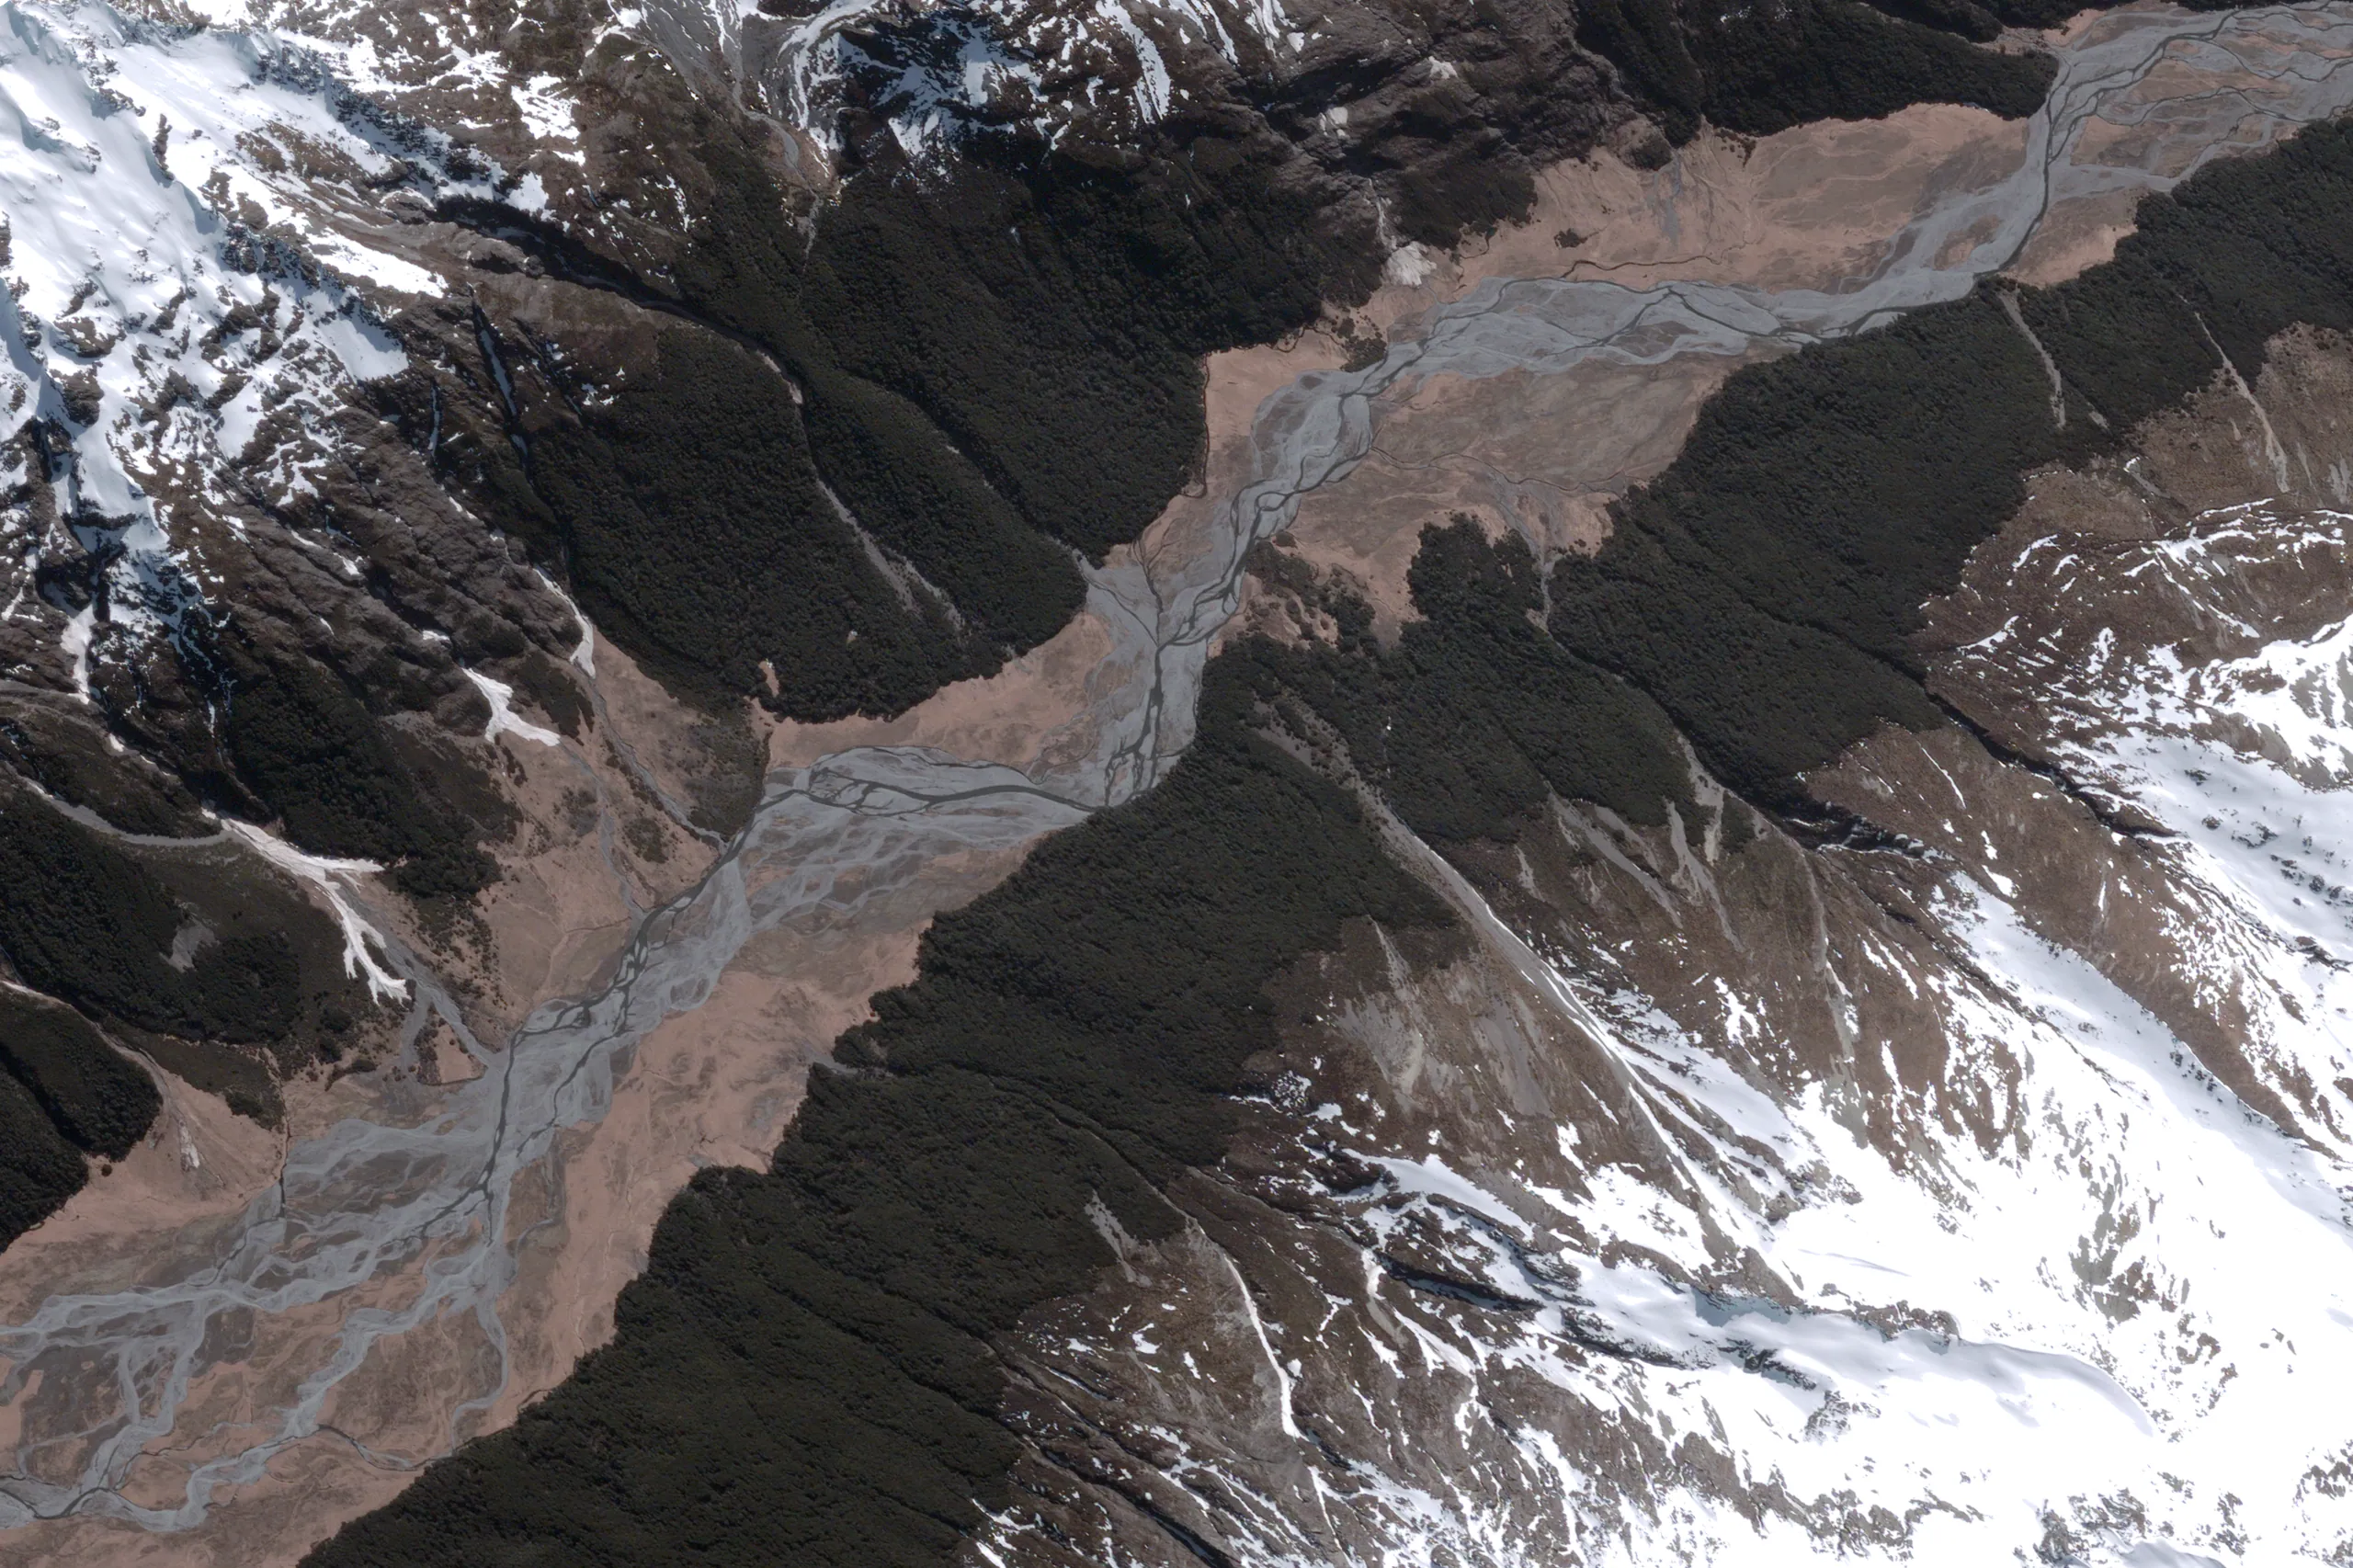
High-resolution optical · 22 Sep 2022
River & wetland · Ahuriri, NZ
See more, measure more, act faster.
One tasking pipeline takes you from raw capture to analysis-ready imagery, elevation products and multiband analytics - delivered into the tools your team already uses.
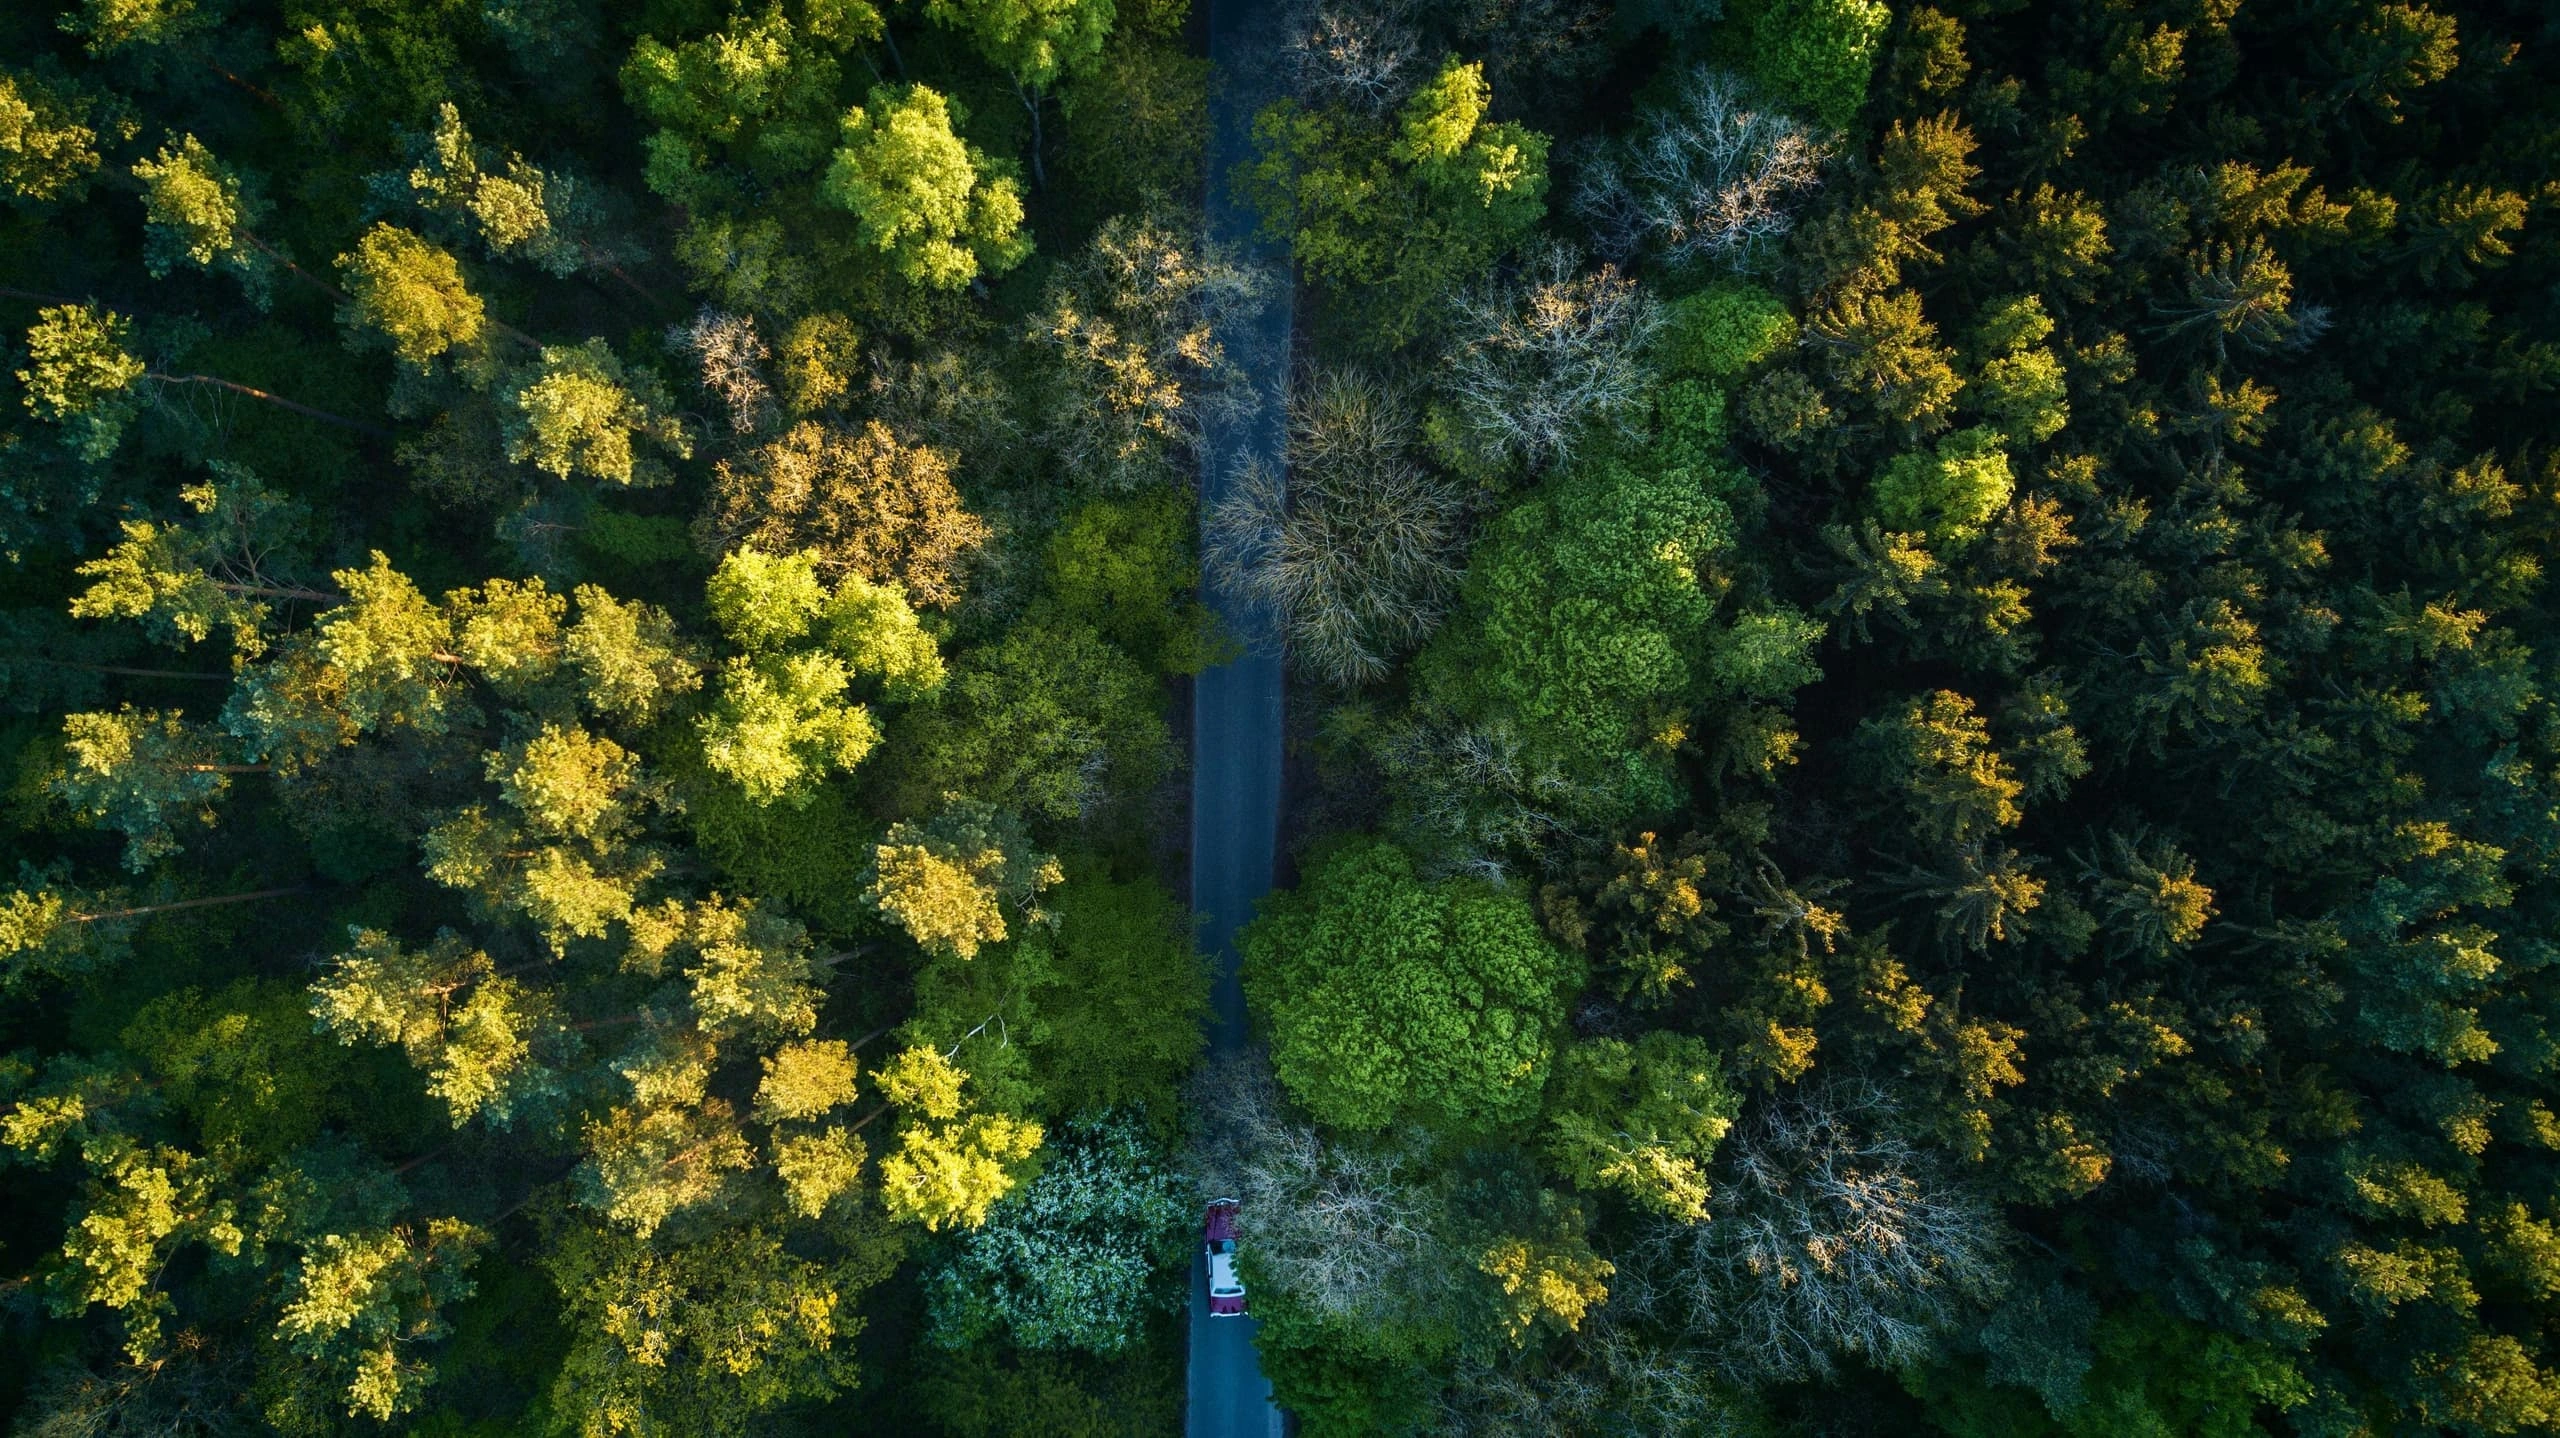
Multi-date, multi-sensor stacks give environmental teams a consistent spatial record across every ecosystem - from the first baseline capture to the latest monitoring run.
Lifecycle
Baseline, monitor, verify - one pipeline.
Three things satellite imagery does for environmental projects, all served by one tasking pipeline - from a 50-year open archive through scheduled monitoring to audit-ready evidence.
01
Baseline
An open-data archive reaching back to 1972, plus high-resolution optical and multispectral capture, defines the starting conditions every carbon, biodiversity or restoration claim is measured against.
- 50+ year open-data archive
- High-resolution optical baseline
- Hyperspectral vegetation profile
- Historical disturbance compilation
02
Monitor
Scheduled optical and multispectral captures across every project area - change detection, vegetation indices and biomass time series on the cadence your method requires.
- Scheduled optical captures
- NDVI / EVI / SAVI time-series
- Change detection & alerts
- Biomass & canopy height products
03
Verify
Audit-ready evidence for ACCU, VCS, EUDR, TNFD and other reporting frameworks - captures with named provenance, reproducible analytics and registrar-compatible data.
- ACCU & VCS verification evidence
- TNFD LEAP condition layers
- Data for IFRS S2 / ISSB disclosure archives
How it works
From baseline question to registrar-ready evidence.
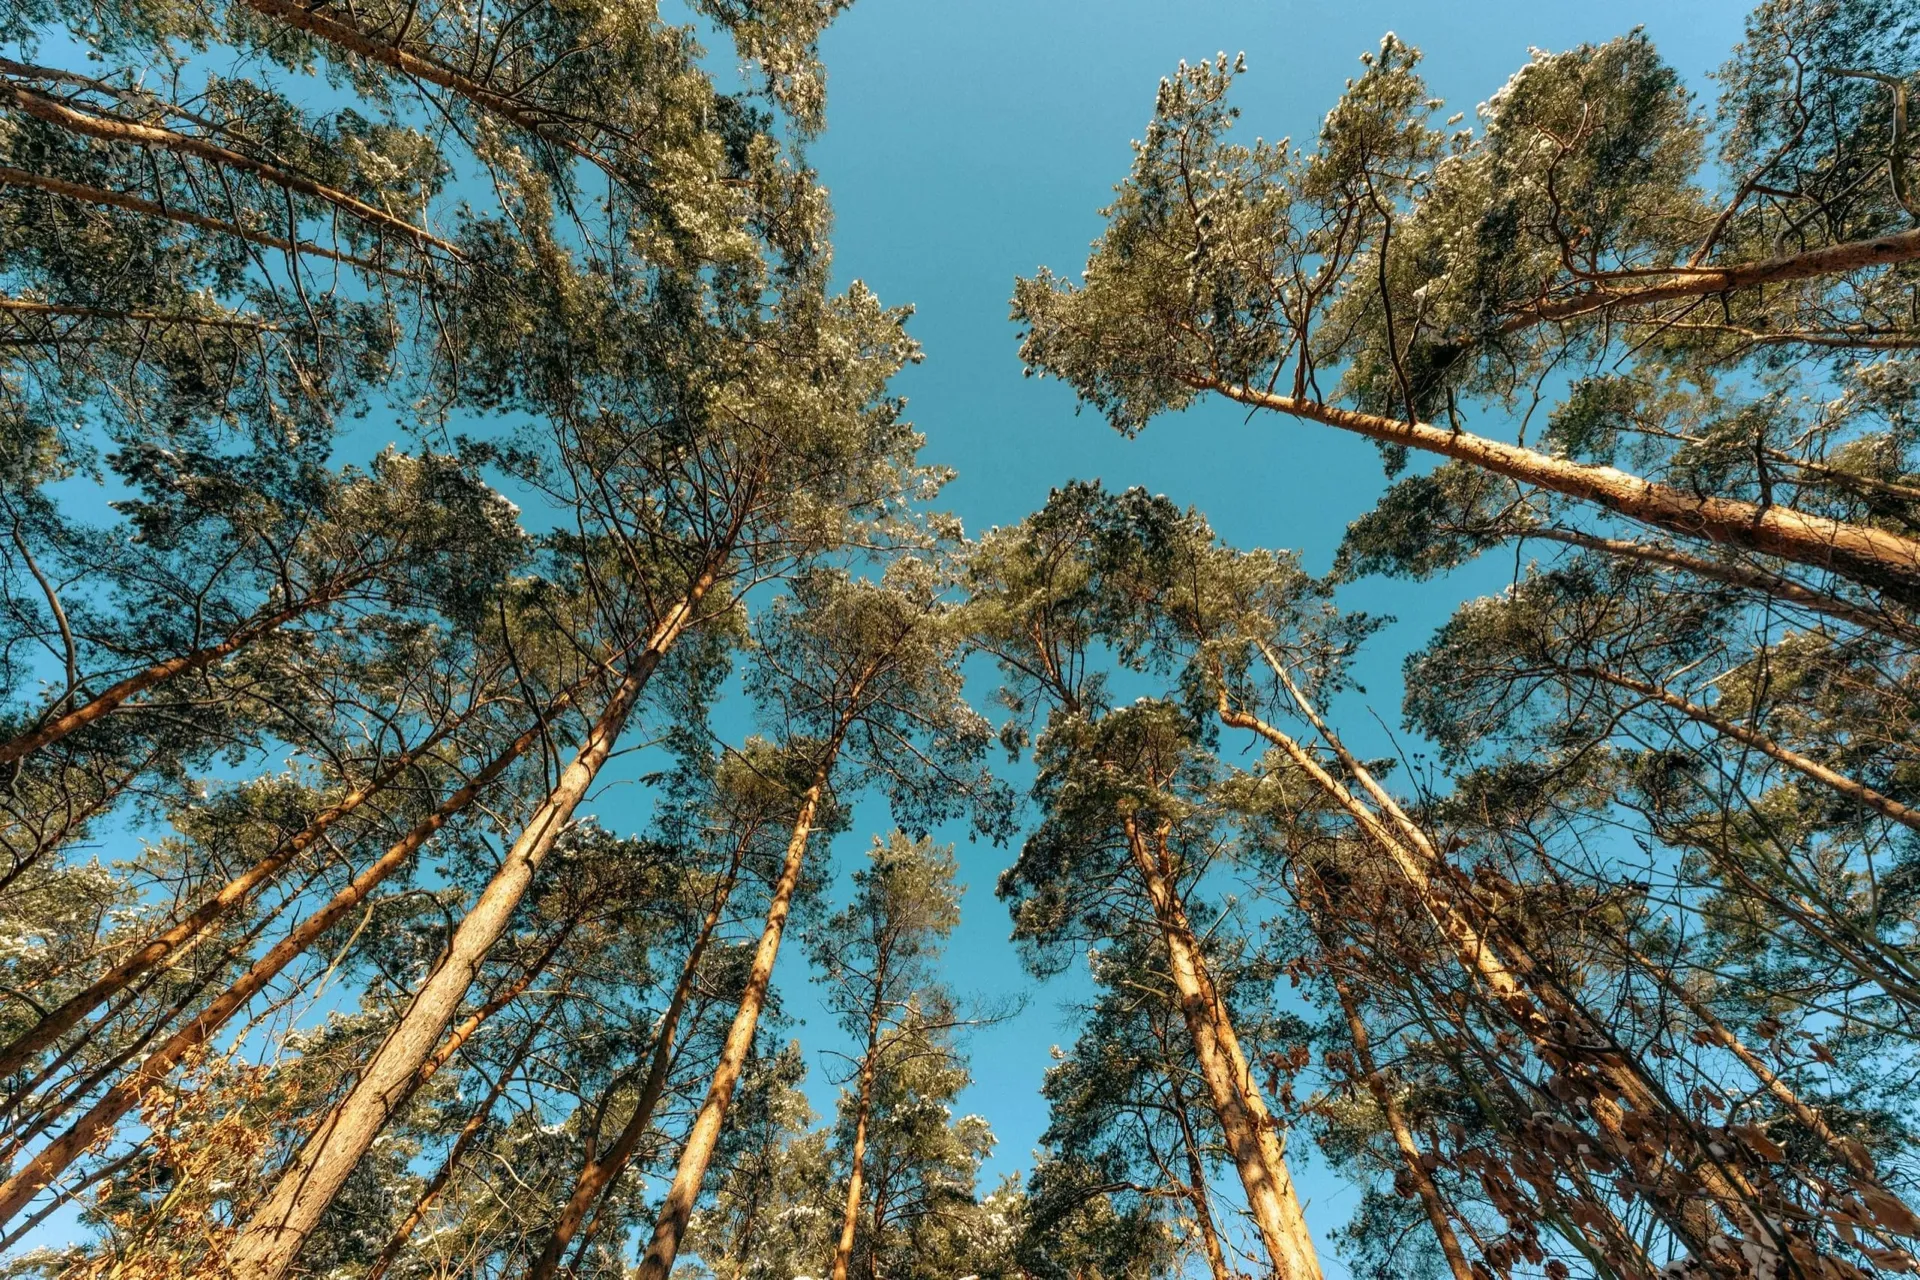
Same pipeline, same provenance - every ecosystem, every framework.
Define your area & method
Upload a shapefile, KML or GeoJSON for your tenure, concession or habitat and tell us the method - ACCU, VCS, EUDR, TNFD. We match sensors, cadence and analytics to it.Task or pull from archive
Our team searches 50+ years of open-data archive and 20+ commercial constellations, and tasks high-resolution capture on the right days. All-weather radar layers in where cloud blocks tropical sites.Process to analysis-ready products
Captures are orthorectified, corrected and cloud-masked to DEA analysis-ready standards. From there we derive vegetation indices, biomass estimates, shoreline polygons, deforestation alerts and fire scars.Deliver to your registrar
Products land in ArcGIS, QGIS, Databricks, Google Earth Engine, Digital Earth Australia or sovereign cloud, in the formats your platform expects - with audit-ready provenance for CER, Verra, Gold Standard, TNFD and IFRS S2.
- Resolution
- 30cm – 10 m
- Time depth
- 50+ yrs
- Cadence
- Daily – Weekly
- Delivery
- Analysis-ready
High-resolution optical imagery, processed and sharpened for project-level detail.
Open-data archive reaching back to 1972 underpins long-baseline carbon, coastal and forest-cover studies.
Priority tasking through to scheduled monitoring - the same area, captured the same way, every time.
Fully processed captures delivered direct to ArcGIS, QGIS, Databricks or Albatross.
Outputs
Delivered across every environmental framework.
The concrete products environmental teams and carbon developers receive across carbon, biodiversity, water, coast, fire and restoration.
Carbon & climate
- ACCU HIR baseline & additionality
- Plantation & environmental planting MRV
- Savanna fire management products
- VCS / Gold Standard verification packs
- EUDR chain-of-custody polygons
Biodiversity & habitat
- Habitat extent & condition layers
- Nature Repair Market evidence
- TNFD LEAP outputs
- IFRS S2 disclosure archives
- GRI 304 biodiversity reporting
Water, wetland & coast
- Ramsar wetland condition mapping
- Algal-bloom & water-quality alerts
- Reservoir & catchment change
- Shoreline change aligned to DEA Coastlines
- Mangrove & seagrass extent for blue carbon
Fire, land & restoration
- Burn-severity mapping
- Fire-scar time series
- Revegetation index tracking
- Mine & site rehabilitation records
- Multi-decadal disturbance archives
Platform
One tasking pipeline, every project.
Coordinate imagery, elevation and specialised data tasking across carbon, biodiversity, water and restoration projects, with centralised budgets, multi-project access and registrar-ready archives.
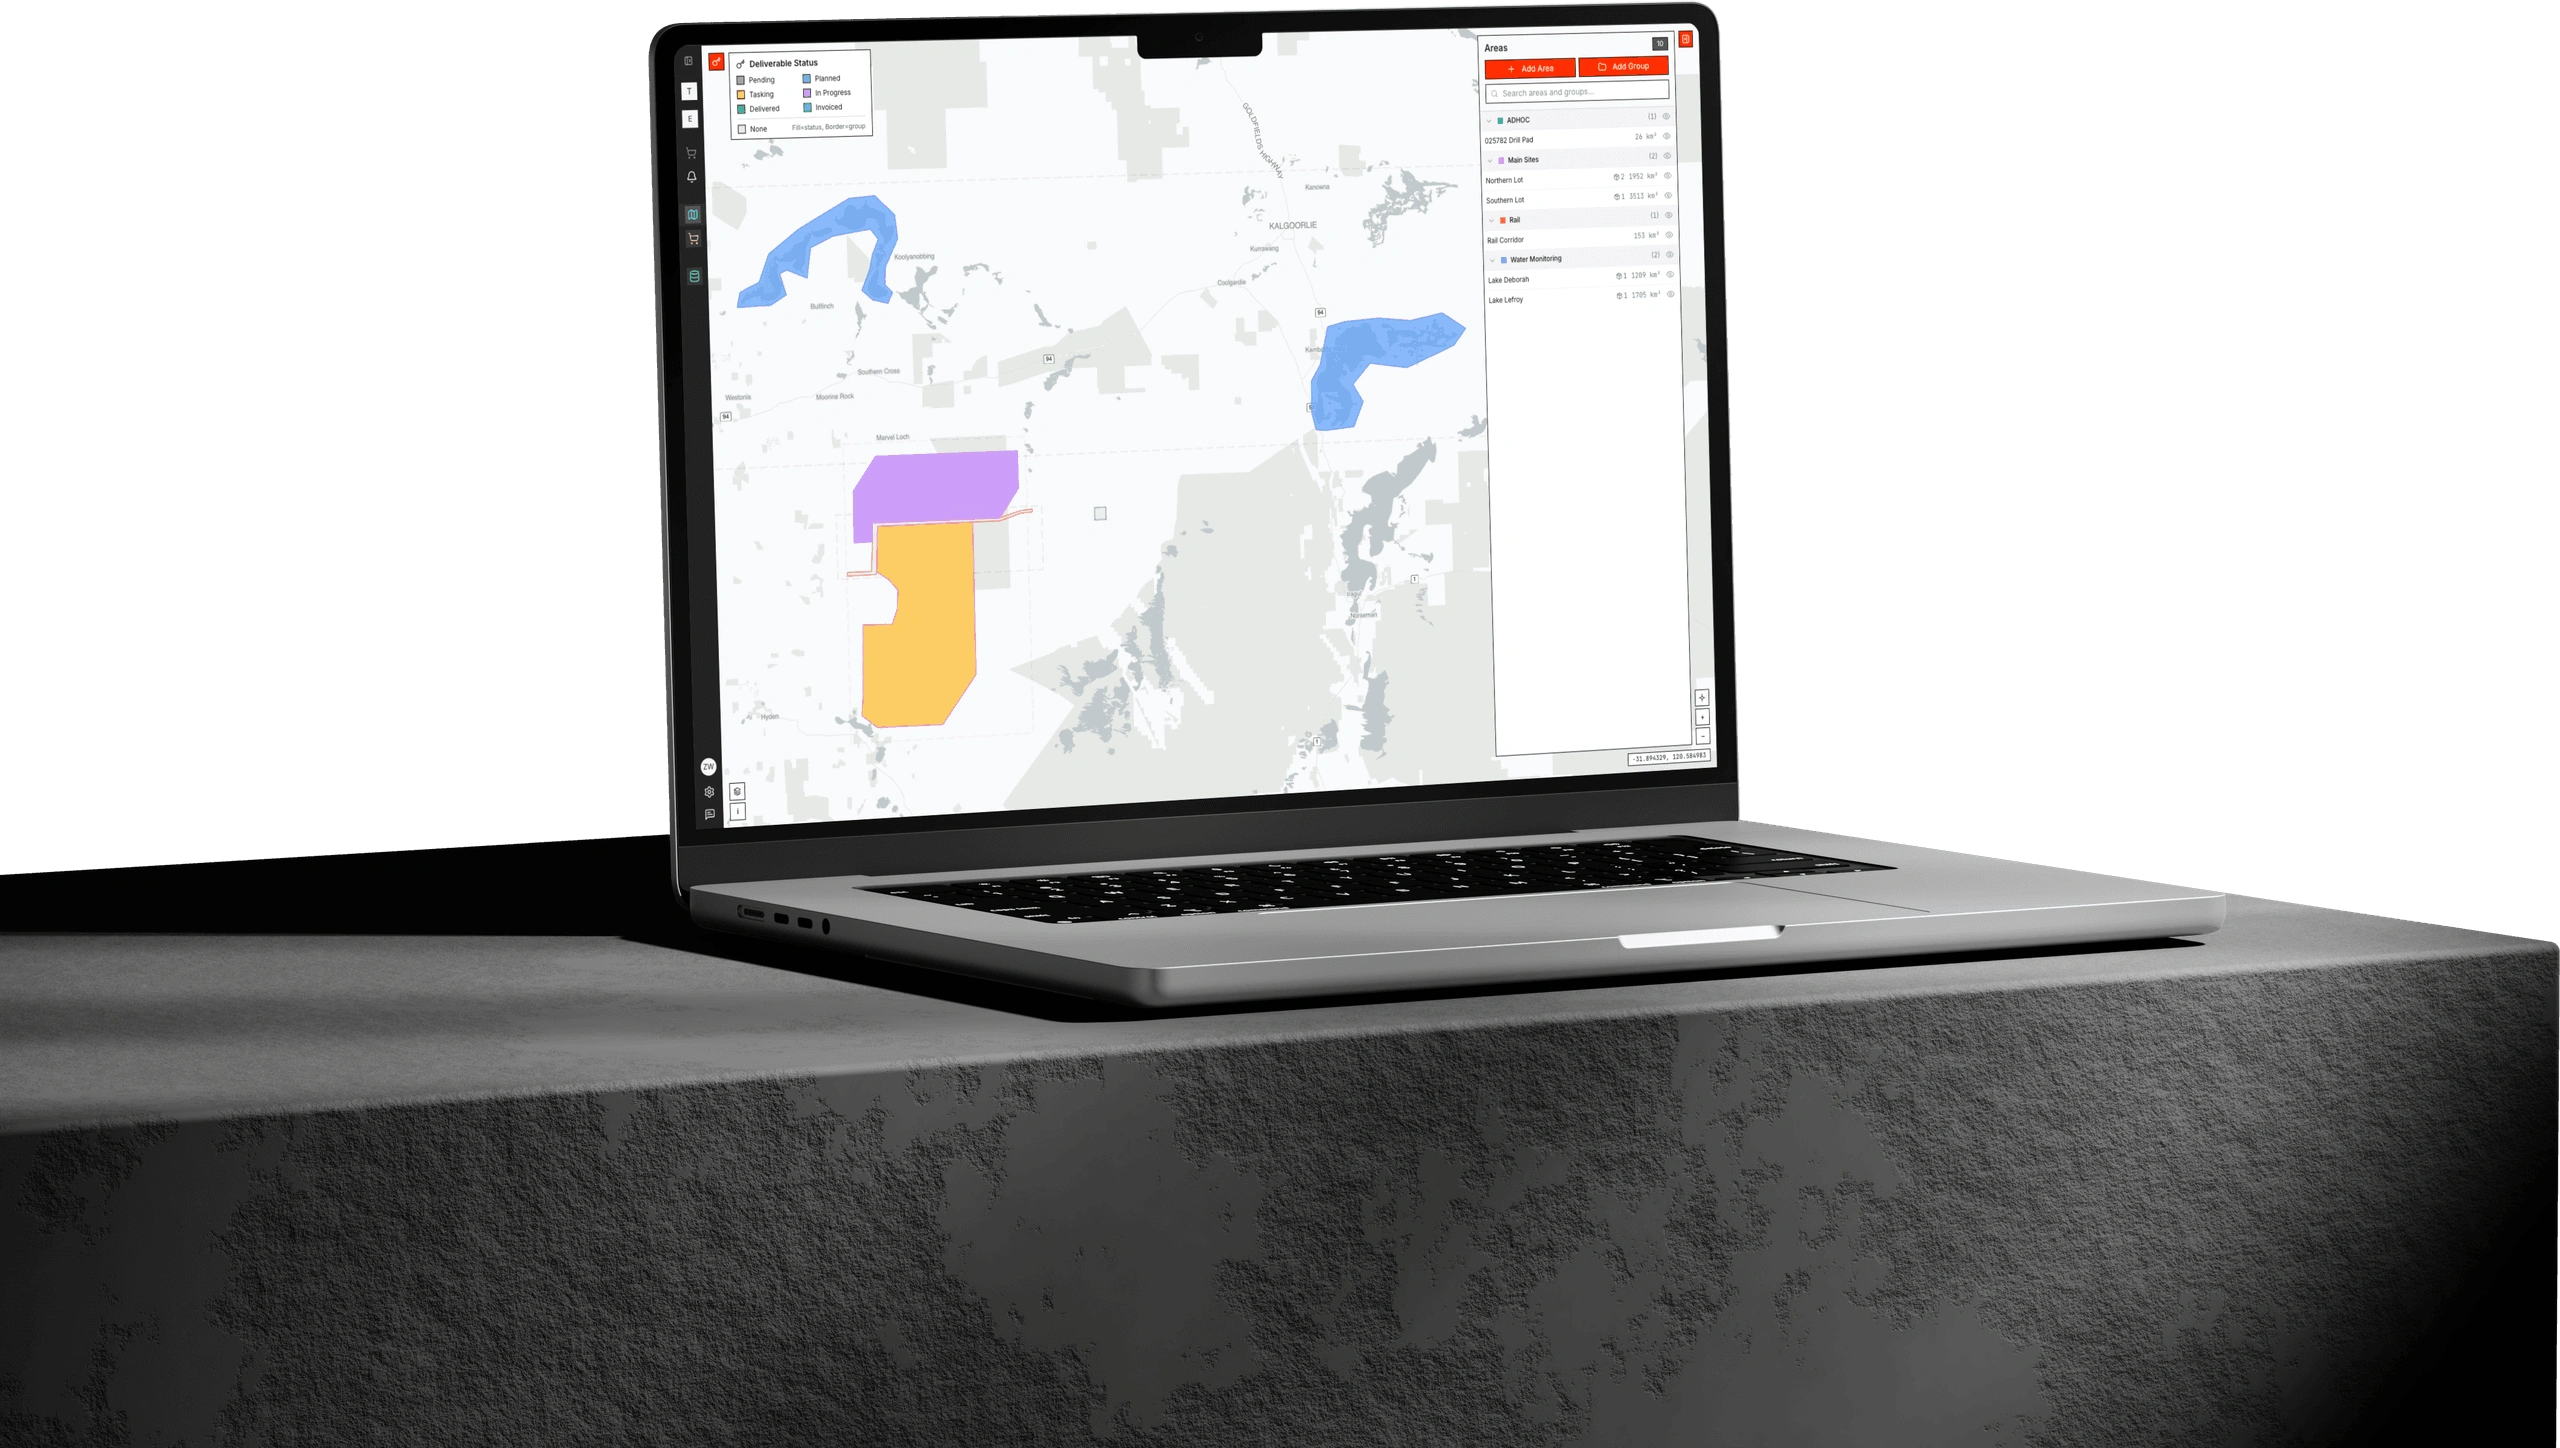

Albatross is where your whole programme orders and manages satellite data. Submit tasking, approve budgets, track deliveries and keep registrar-ready audit trails aligned to ACCU, VCS, EUDR and TNFD evidence requirements.
Products
The data products behind the page.
Products
Satellite Imagery
Analysis-ready optical and multispectral imagery for carbon baselines, EUDR due diligence, habitat condition, shoreline change and fire-scar mapping, with a 50-year open-data archive included.
Products
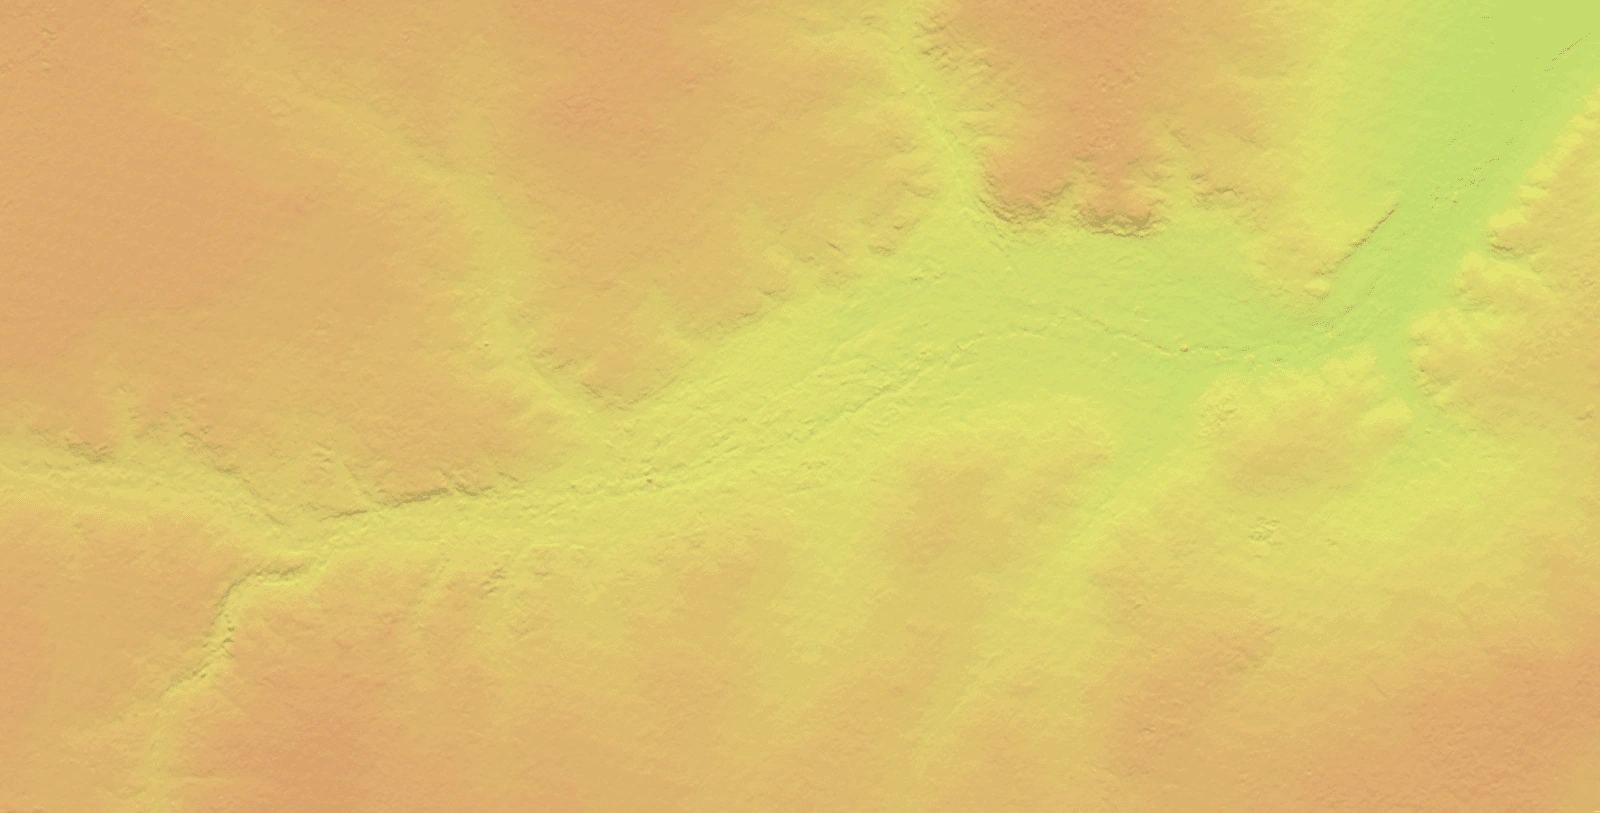
Digital Elevation Models
Elevation products from 0.5m to 5m resolution for canopy modelling, catchment analysis, shoreline baselines and restoration terrain, aligned to GDA2020.
Build evidence you can stand behind
Talk to the team about imagery, elevation and analytics for your carbon, biodiversity, water and restoration projects, from baseline to registrar-ready verification.