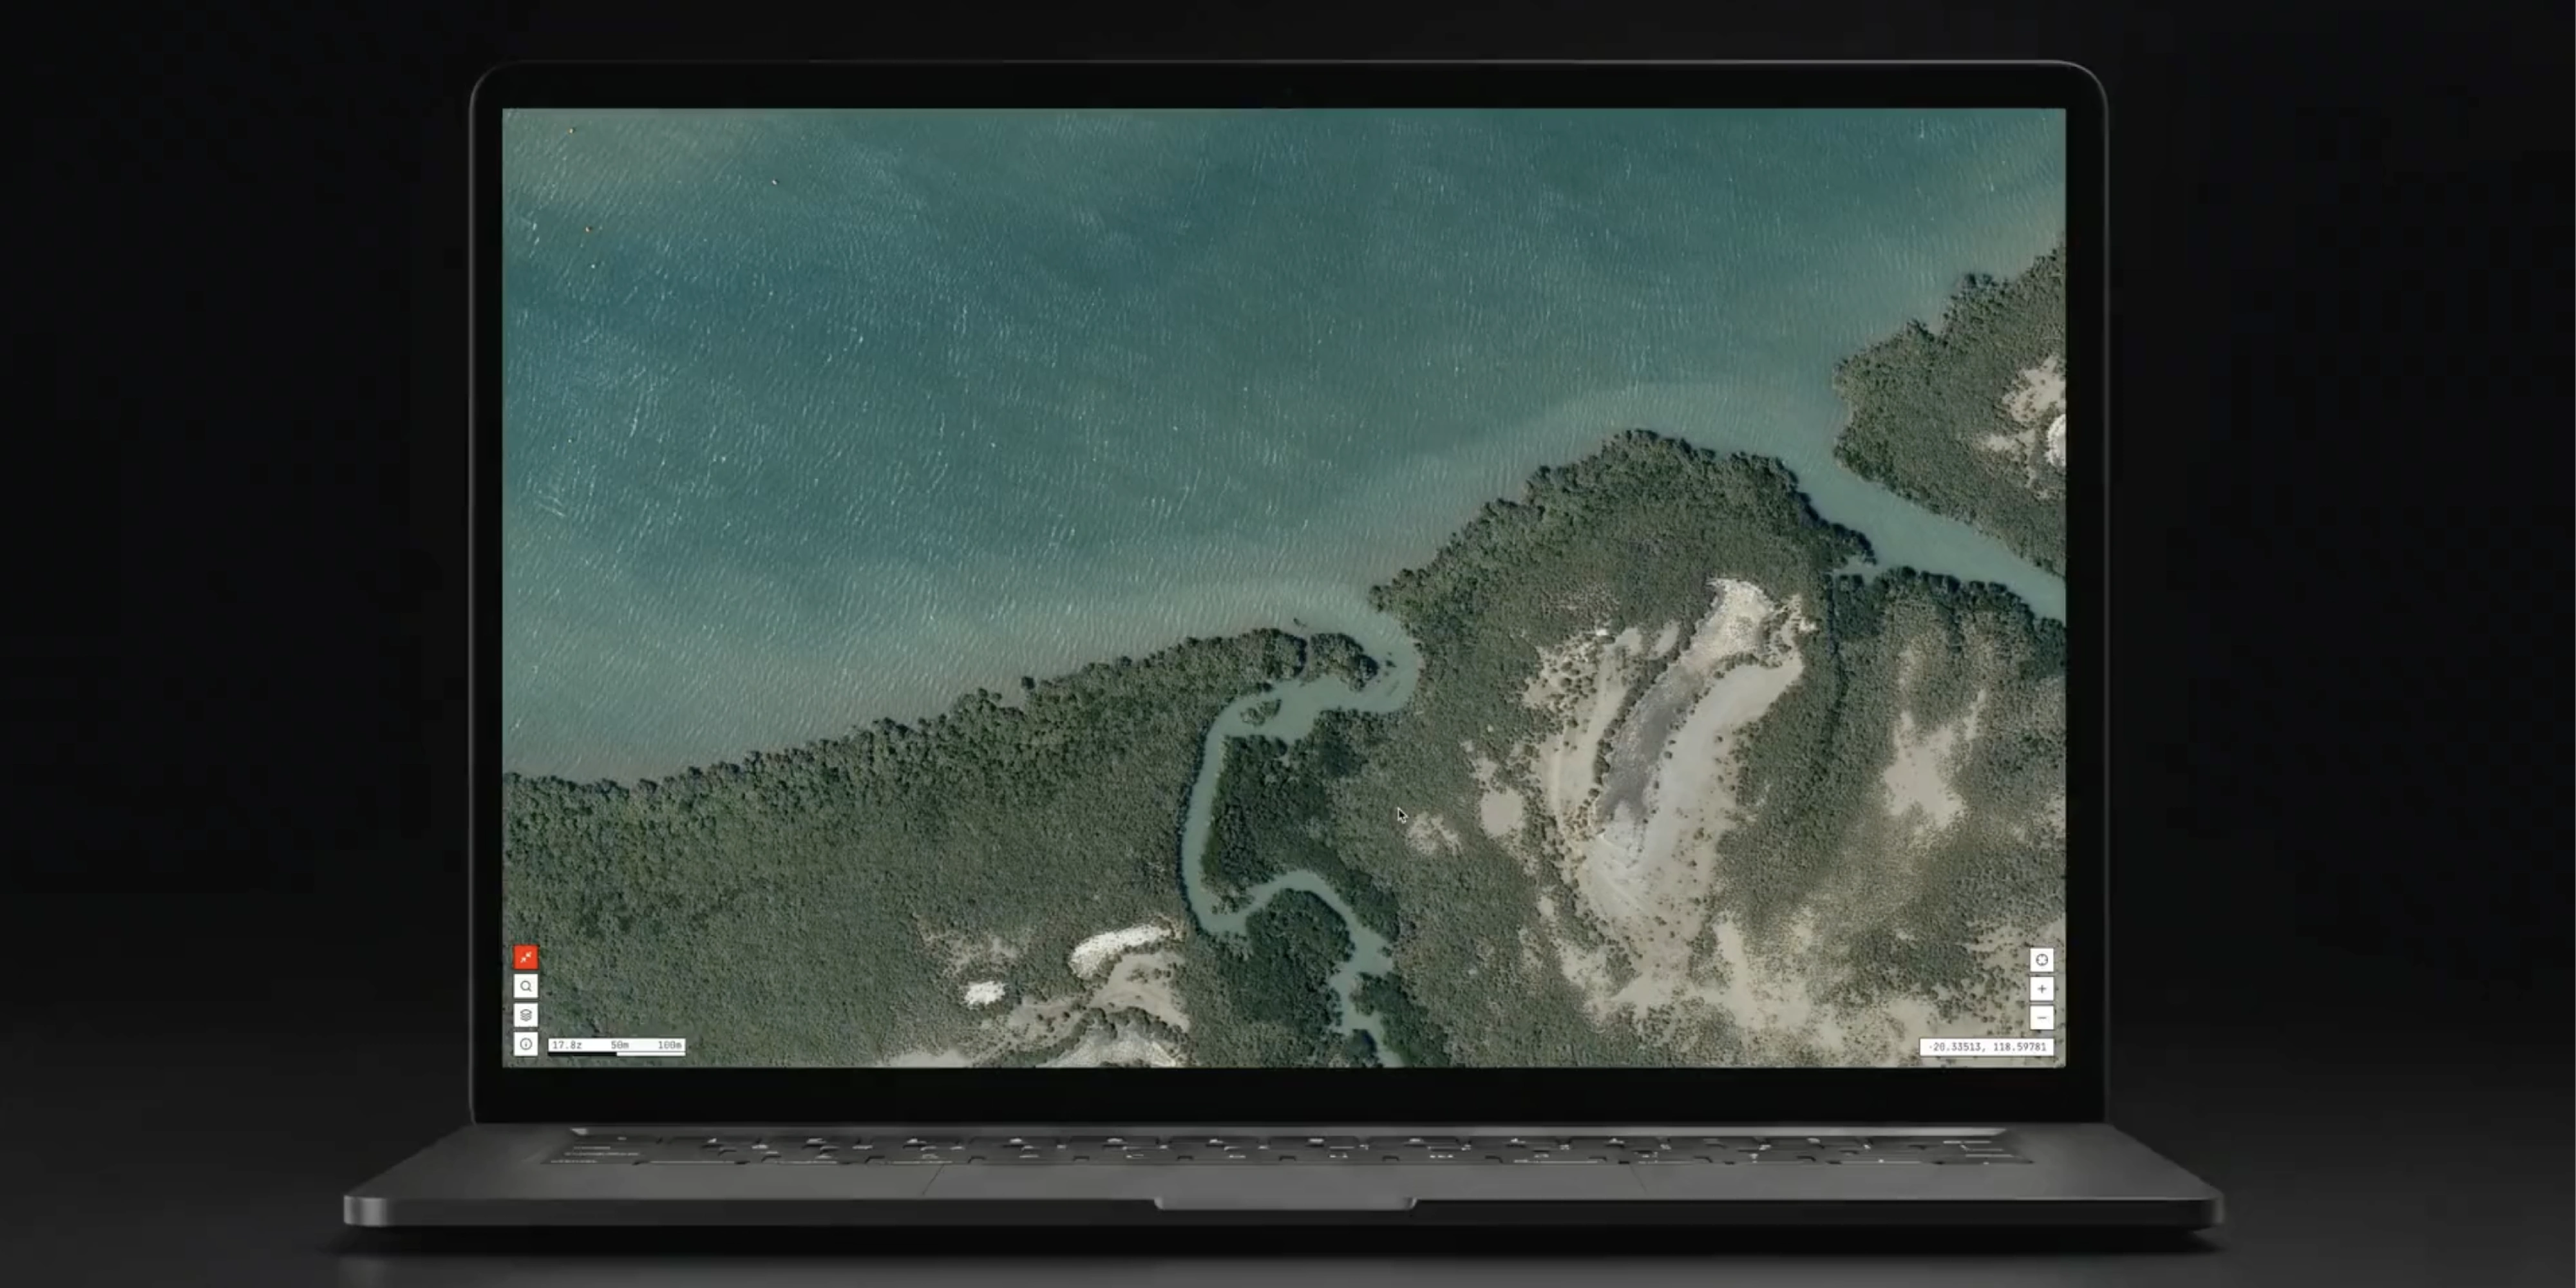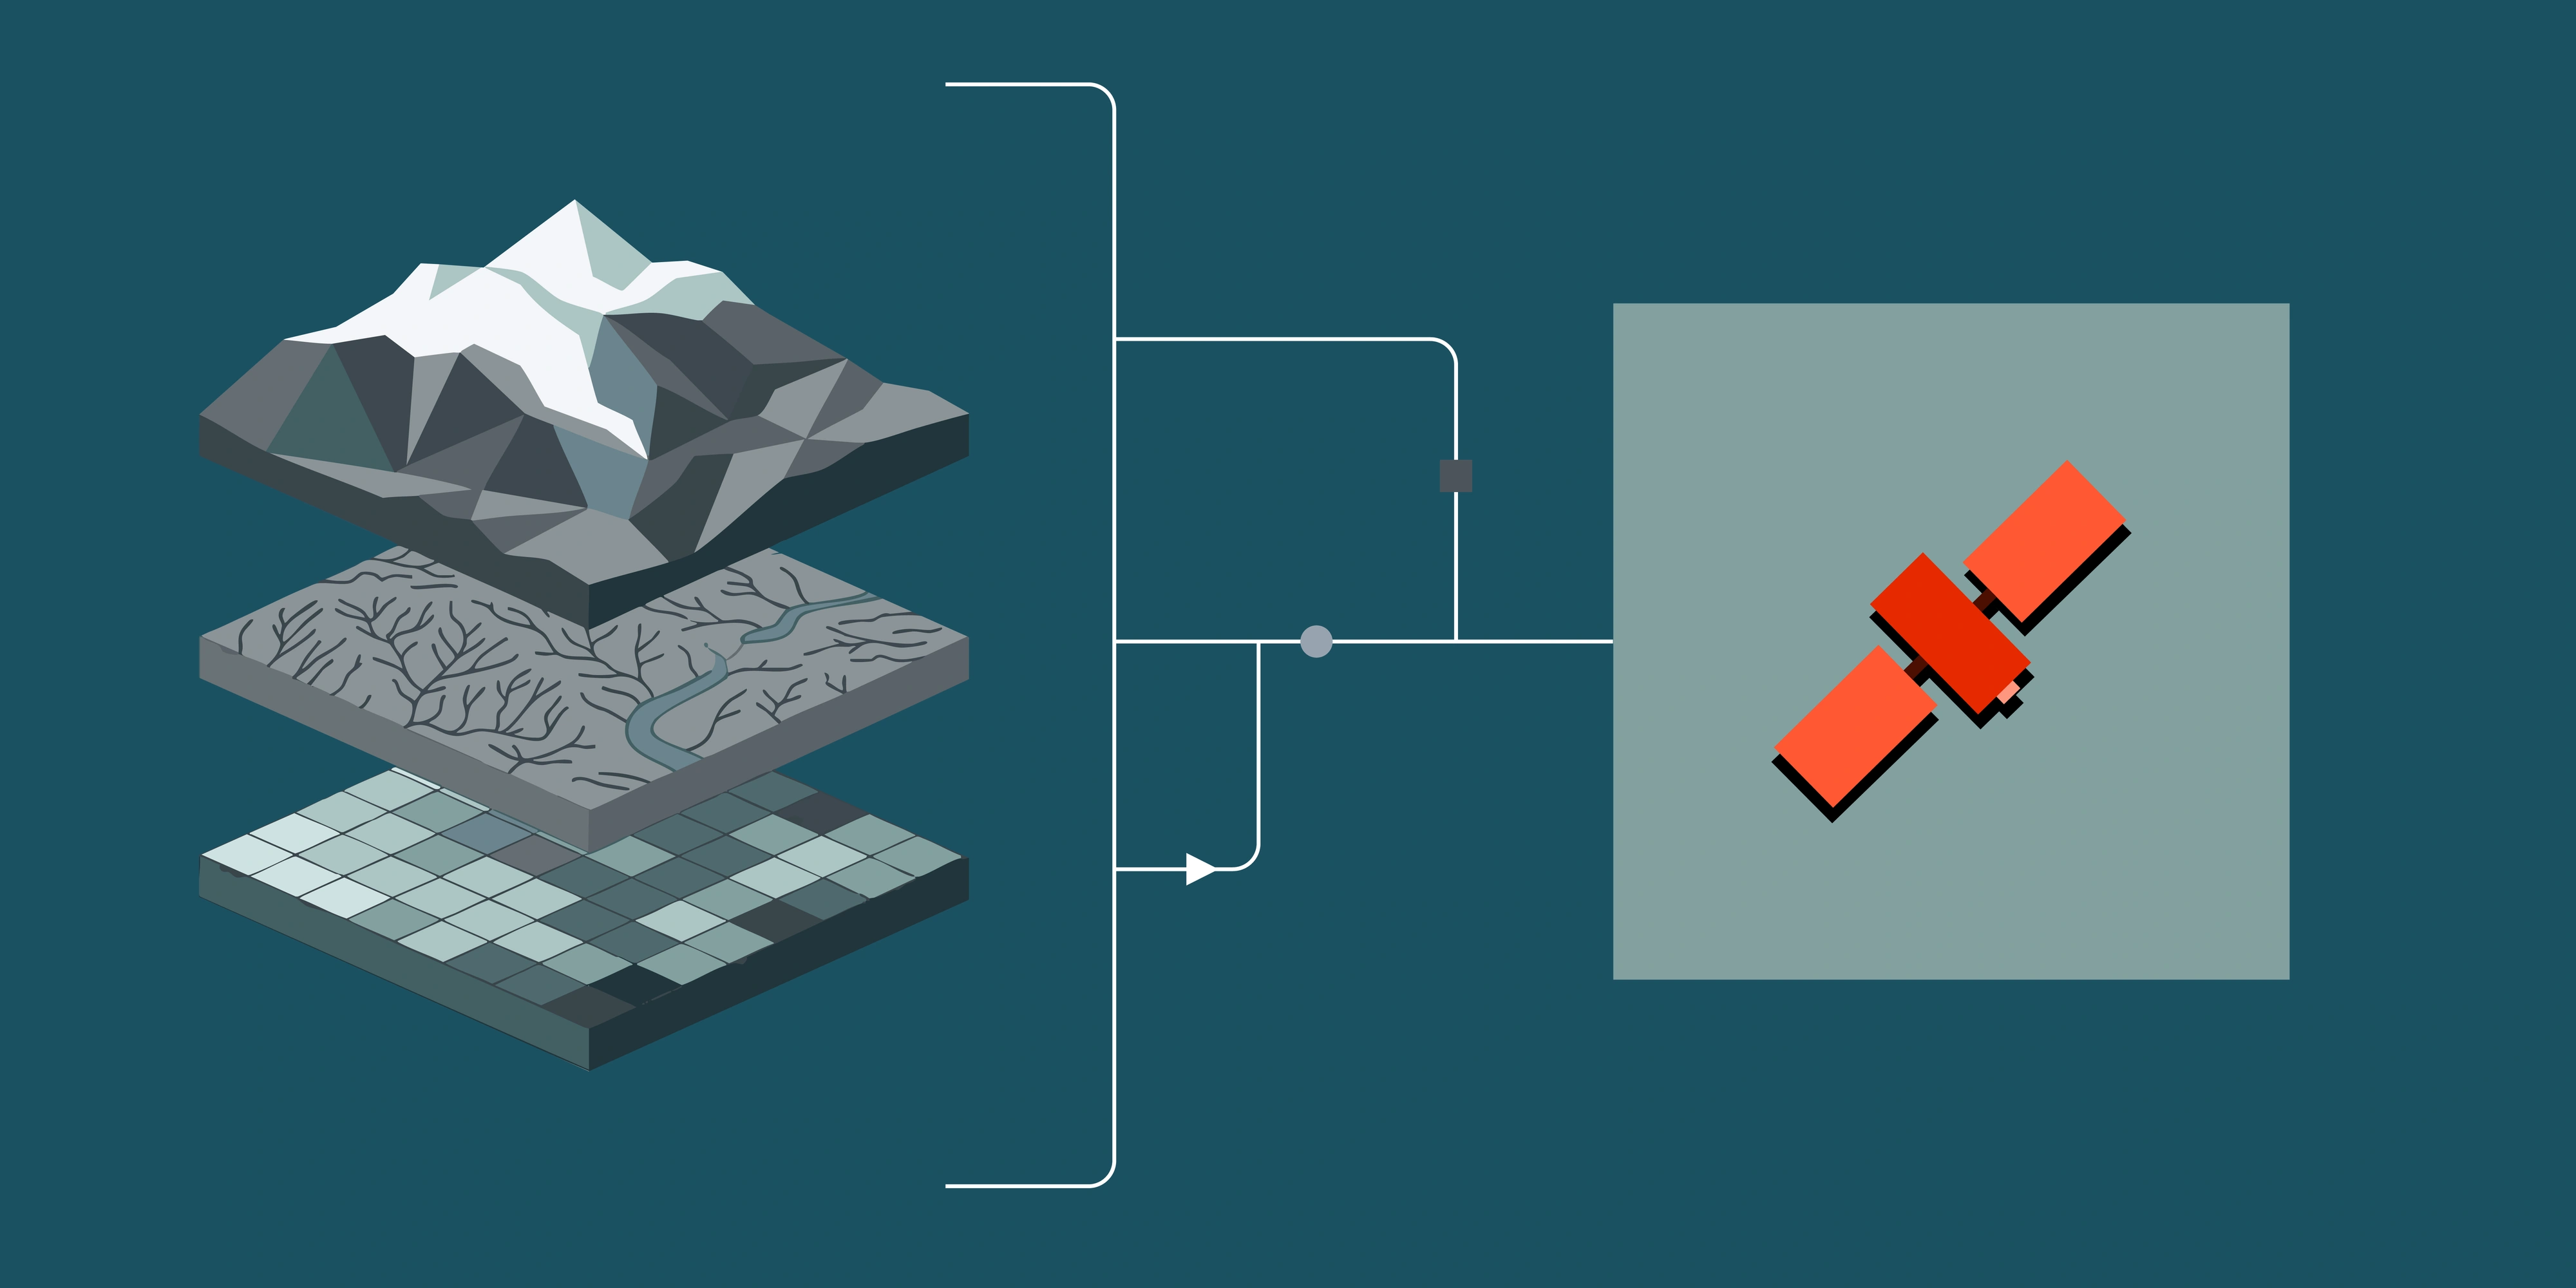
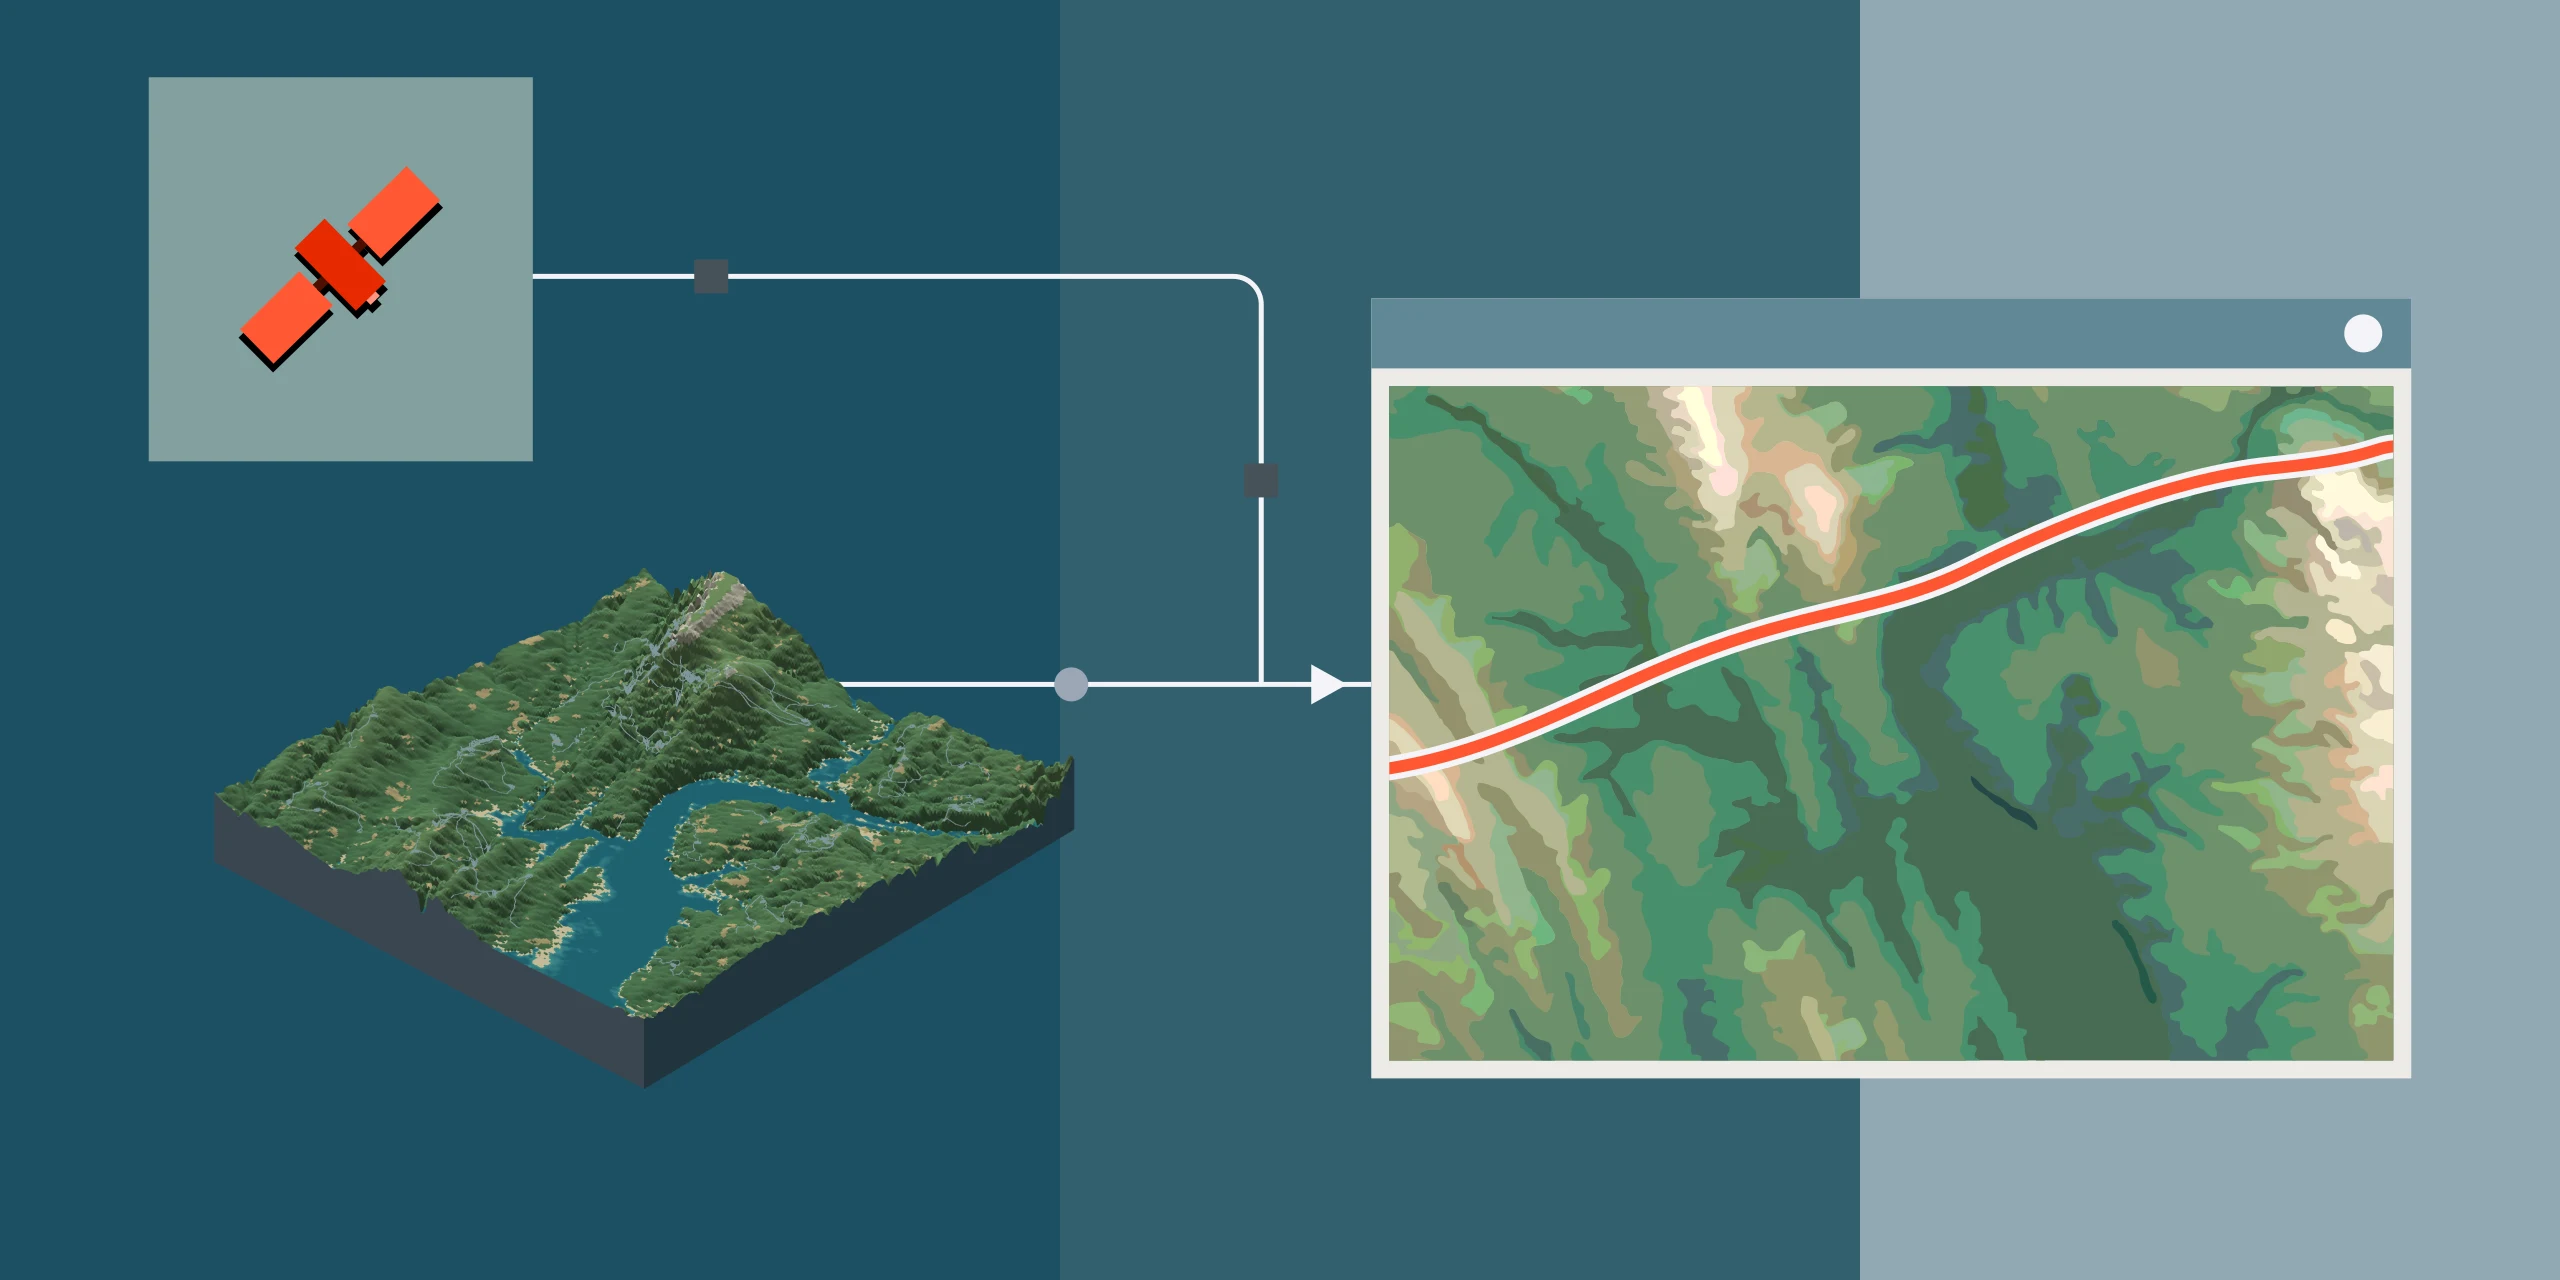
Every linear project starts as a line on a map and the cost of getting that line wrong grows with every kilometre of design built on top of it. Before anyone walks a corridor or books a survey flight, route options are compared at the desktop. Satellite-derived terrain models (DTMs and DSMs), paired with 30cm-class imagery, put real terrain, drainage and land use behind that comparison across hundreds of square kilometres. If you're new to elevation data, start with our explainer on how DEMs, DSMs and DTMs are made from satellite imagery.
Key takeaways
- Desktop route selection compares corridor options against terrain, drainage, environmental, tenure and access constraints before field work begins.
- A 50cm satellite stereo DTM shows slopes, gullies, creek banks and existing formations that free 30m elevation data cannot resolve.
- Each asset weighs terrain differently: rail is the most grade-sensitive, pipelines care about side slope and crossings and powerlines care about tower sites and vegetation clearance.
- Satellite elevation suits options and feasibility work. Once a preferred corridor is chosen, LiDAR and ground survey over the narrowed strip give the accuracy needed for detailed design.
What is a desktop route selection study?
A route selection study (also called an options study, corridor study or alignment selection) narrows a broad study area down to a preferred corridor for a new road, railway, pipeline or transmission line. It usually sits at concept or pre-feasibility stage, when the start point, end point and a handful of control points are fixed but almost everything in between is open.
Most of the work happens at the desktop. Teams map constraints, draw candidate alignments, screen them for terrain and crossings, score them with a multi-criteria analysis (MCA) and shortlist one or two options to carry into field investigation. The quality of that shortlist depends heavily on the quality of the base data.
Where does satellite data fit?
There are four common sources of terrain and land information for a corridor study:
- Free global DEMs such as SRTM and the Copernicus DEM, which cover Australia at 30m resolution. Both are surface models, so in timbered country their heights sit partly on the canopy rather than the ground.
- Satellite stereo imagery, processed into a DSM and DTM at 0.5m to 5m resolution, with matching high-resolution colour imagery.
- Airborne LiDAR, the most accurate option from the air, which also sees the ground through gaps in canopy, but needs an aircraft mobilised to site.
- Field survey, the reference standard, but only practical over a small region.
Satellite data sits between free data and LiDAR: consistent coverage over a wide study area, including remote ground that would be slow or expensive to fly, at a detail that resolves the features that actually move a route. Our overview of earth observation data types compares these sources in more depth.
What should you map in a route selection study?
Most options studies build a constraint map from the same core themes - imagery and elevation data contribute directly to most of them:
- Terrain and slope: grades, side slopes, ridgelines, escarpments and the cut and fill needed to hold a formation.
- Drainage and flooding: creek lines, floodplains, catchment boundaries and the number and size of waterway crossings.
- Vegetation and clearing: remnant vegetation, riparian zones and the extent of clearing each option would need.
- Land use and tenure: cropping, grazing, mining tenements, conservation areas, towns and homesteads.
- Existing infrastructure: roads, tracks, rail, easements, fences and dams to follow, cross or avoid.
- Geohazards: past landslides, unstable slopes, erosion-prone ground, salt lakes and soft ground.
- Access: where construction crews and maintenance vehicles can reach the route.
Geohazards deserve particular attention because they are easy to miss at desktop stage and expensive to discover later. Comparing imagery from different dates can reveal past slope failures and erosion scars and the same slope character can then be checked elsewhere along each option.
Before (WorldView-2, 50cm)
After (WorldView Legion, 30cm)
How are satellite DTMs and imagery used, step by step?
The workflow below is typical for a desktop options study, although the order varies between projects.
1. Define the corridor envelope
Start with the fixed points: the origin, the destination and any control points such as a port, substation, interchange or known crossing. Draw an envelope wide enough to hold every credible option. That envelope becomes the area of interest for imagery and elevation data. Terrabit's minimum order for a satellite DEM is 100 km², which a corridor envelope reaches quickly: a 2km-wide band along a 50km route is already 100 km².
2. Source the data
Check the archive first. Stereo imagery may already exist over part or all of the envelope, which avoids waiting for a new capture. Where it doesn't, or where recent change matters, a new stereo acquisition can be tasked. Our guide to archive vs tasking covers the trade-offs, and you can search existing coverage yourself in Albatross.
The stereo pair is processed into a DSM, filtered to a bare-earth DTM and the imagery is orthorectified so the two line up. Pixel size is only part of the decision: our article on resolution, GSD and accuracy explains what else determines whether data is fit for measurement.
3. Build the constraint layers
From the DTM, derive slope classes, aspect, flow paths and catchments. From the imagery, map vegetation, land use, tracks, fences, buildings and water. Then add third-party layers such as cadastre, tenure, environmental mapping and heritage registers. Delivered as GeoTIFFs in GDA2020, these drop straight into a GIS; see how to add satellite imagery into QGIS and our comparison of COG, GeoTIFF, ECW and WMTS formats.
Existing corridors are one of the most useful layers. An existing road reserve, track or easement may already be cleared, accessible and agreed with landholders, which often makes it the cheapest and least contested place for new infrastructure. Imagery shows where those corridors run, what condition they're in and what has already been built alongside them.
4. Screen options for slope and earthworks
Draw candidate alignments and pull long-sections and cross-sections from the DTM. Sections show where an option exceeds its grade limit, where it would need deep cuts or high fills and where steep side slopes make a bench expensive or unstable. Rough cut and fill volumes per option can be estimated at this stage, which is often enough to rule an option out.
30cm RGB imagery
50cm satellite-derived DTM
5. Assess the crossings
Every creek, river, road, rail line and existing service crossed is a cost and a risk. The DTM shows channel shape and floodplain width at each candidate crossing and the imagery shows bed material and riparian vegetation. Comparing crossings side by side often decides between otherwise similar options.
30cm RGB imagery
50cm satellite-derived DTM
6. Score and shortlist with multi-criteria analysis
A multi-criteria analysis weights each criterion (length, earthworks, crossings, clearing, tenure, heritage, access and cost) and scores every option against it. Because every option is measured from the same terrain model and imagery, the scores are comparable. A good MCA also shows how the ranking changes when the weights change.
7. Verify in the field
The shortlist then goes to the field. Site visits, geotechnical investigation, ecology surveys and heritage assessment test what the desktop study inferred. Satellite data narrows where those visits go; it doesn't replace them.
What matters most for each asset type?
The same constraint map serves every linear asset, but each one weighs it differently.
Roads and rail follow the ground closely, so grade and earthworks dominate. Rail is far more sensitive to grade than road, which is why rail options studies lean so heavily on continuous long-sections: a small change in alignment can swing earthworks volumes substantially.
Pipelines are usually buried, although some, such as water and slurry lines, are laid above ground on supports, depending on the product, ground conditions and access needs. Either way they can follow terrain more freely than roads or rail, but steep side slopes make a right of way hard to build and maintain and every watercourse crossing needs a crossing method decision.
Powerlines span terrain rather than follow it, so grade matters less than where structures can stand and how crews will reach them. The other major factor is vegetation. Tree canopy is typically cleared along a wide corridor under the conductors and then managed for the life of the line, so the width and extent of clearing is a key difference between options and that's a encroachment question suitable for satellite imagery monitoring.
Terrabit supports corridor work for infrastructure and energy projects, and our guide to where to use DEMs covers how the same data serves other industries.
Which elevation data should you use at each stage?
Most studies step up in detail as the area of interest shrinks.
Free 30m data is often enough to set the envelope, but a single 30m pixel is wider than most road formations. It can't show the creek banks, spurs and benches that decide between options.
Within satellite stereo, resolution is a choice too. The comparison below shows the same ridge and creek system as a 50cm DTM and a 1m DTM. Both resolve the drainage lines and ridges a route has to cross or follow and the 1m model, from a drier, lower-vegetation capture, is as clean as the 50cm one. The right choice depends on the detail your screening needs, the vegetation at capture time, the archive available over the envelope and your budget.
50cm DTM (WorldView Legion)
1m DTM (WorldView-2)
What should Australian route studies account for?
A few local factors shape how corridor data is specified and used in Australia.
- Datum and projection. Specify GDA2020 and the MGA zone that covers the corridor. Long east-west corridors can cross a zone boundary, so agree early whether to split the data by zone or use a project grid. Terrabit DEMs can be delivered in WGS84, GDA2020 or local grids.
- Vertical datum. Australian design levels are on the Australian Height Datum (AHD). Confirm which height reference each elevation layer uses (ellipsoidal, above mean sea level, a global geoid or AHD via AUSGeoid2020) and convert before comparing satellite, LiDAR and survey levels, because ellipsoidal heights can differ from AHD by tens of metres.
- Patchy LiDAR in remote areas. Geoscience Australia's ELVIS portal gives free access to a lot of state and national elevation data, but LiDAR has not been flown everywhere. Many remote and regional corridors have nothing finer than free 30m data and that is where satellite stereo fills the gap.
- Native vegetation and the EPBC Act. Clearing for a corridor can trigger state native vegetation approvals and impacts on matters of national environmental significance can require referral under the Environment Protection and Biodiversity Conservation Act 1999. Mapping vegetation extent from current imagery helps options avoid the most sensitive areas early. Ecological advice still sets the requirements.
- Aboriginal cultural heritage. Heritage obligations sit under state and territory legislation, alongside native title. Imagery can't identify heritage sites; that needs engagement with Traditional Owners and qualified heritage advisers and early engagement can shape which options go forward.
- Flooding. Flood estimation in Australia follows Australian Rainfall and Runoff (ARR). A desktop DTM supports early catchment delineation and identifies floodplain crossings, but design flood levels need hydrological and hydraulic modelling on survey-grade terrain.
When should you move from satellite data to LiDAR and field survey?
Satellite elevation is a feasibility tool and it's worth being clear about its limits:
- Vertical accuracy. Terrabit's satellite very high resolution DTMs reach around 50cm LE90 vertical with ground control in open terrain. Without control, absolute accuracy is typically a few metres (around 3m LE90), with relative accuracy within a scene better than absolute. That is enough to compare options, but not for detailed design grades or earthworks quantities for tender.
- Vegetation. Stereo photogrammetry only sees the top surface. Under closed canopy, the DTM is an estimate of the ground, not a measurement of it.
- Cloud and voids. Stereo capture needs clear skies - open water, uniform sand and deep shadow can come back as voids or noise.
- Ground control. The best accuracy depends on surveyed ground control points, which take planning in remote areas.
The usual pattern is to use satellite data across the full envelope, choose a preferred corridor, then fly LiDAR over the narrowed strip. Airborne LiDAR is typically accurate to 5 to 15cm vertically and flying a narrow strip along one alignment costs far less than flying the whole envelope.
Once construction starts, the same imagery sources support progress tracking and alignment checks. Our guide to satellite monitoring for remote operations covers that phase.
Frequently asked questions
Can satellite data replace LiDAR for route selection? For comparing options across a large study area, satellite stereo is often the better fit, because it covers the whole envelope consistently and doesn't need an aircraft mobilised to site. For detailed design, no. LiDAR and ground survey over the preferred corridor remain the standard.
What resolution DTM do I need for a corridor options study? A 50cm to 1m DTM resolves gullies, creek banks, spurs and existing formations, which are the features that separate one option from another. Free 30m data is useful for setting the envelope but too coarse to compare crossings.
How accurate is a satellite-derived DTM? Up to ±0.5m LE90 vertical with ground control, depending on terrain. Without control, expect absolute accuracy of a few metres, with relative accuracy within a scene better than absolute. Under dense canopy, ground heights are estimated rather than measured.
How long does it take to get a DTM for a corridor? Terrabit's DEM delivery time is 5-10 business days, depending on project size and complexity. If no suitable stereo archive exists, a new capture has to be tasked first typically taking 1-2 weeks in Australia before processing can begin.
Do I need a DSM or a DTM for powerline routing? Usually both. The DTM supports structure siting, access tracks and ground clearance profiles and the DSM shows the tops of features - e.g infrastructure and tops of dense canopy
Plan your corridor options study with Terrabit
A route options study is only as good as the terrain under it. Satellite DTMs and 30cm imagery give consultancies, utilities, asset owners and government teams a consistent baseline across every option, before money is spent on survey flights and field crews.
Send us your corridor and we'll check archive stereo coverage across it, then quote a DTM and imagery package most suited to your use case.