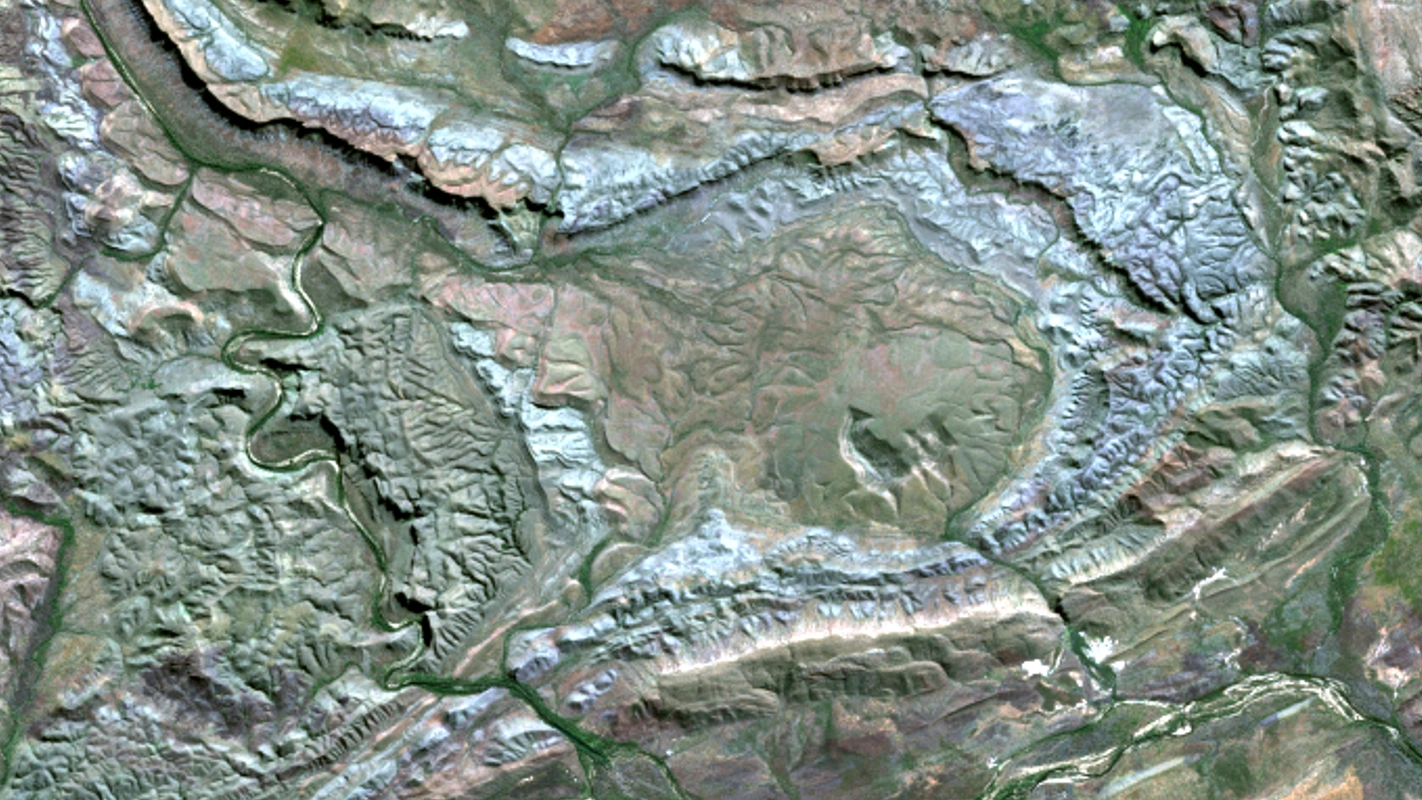
Multispectral satellite imagery is one of the most widely used forms of Earth observation data. It underpins a large proportion of operational satellite workflows across government, mining, environmental monitoring, agriculture and disaster response.
In simple terms, multispectral imagery captures Earth data in multiple specific wavelengths of light - beyond what the human eye can see - allowing us to analyse vegetation, water, soil and built environments in far greater detail than standard imagery.
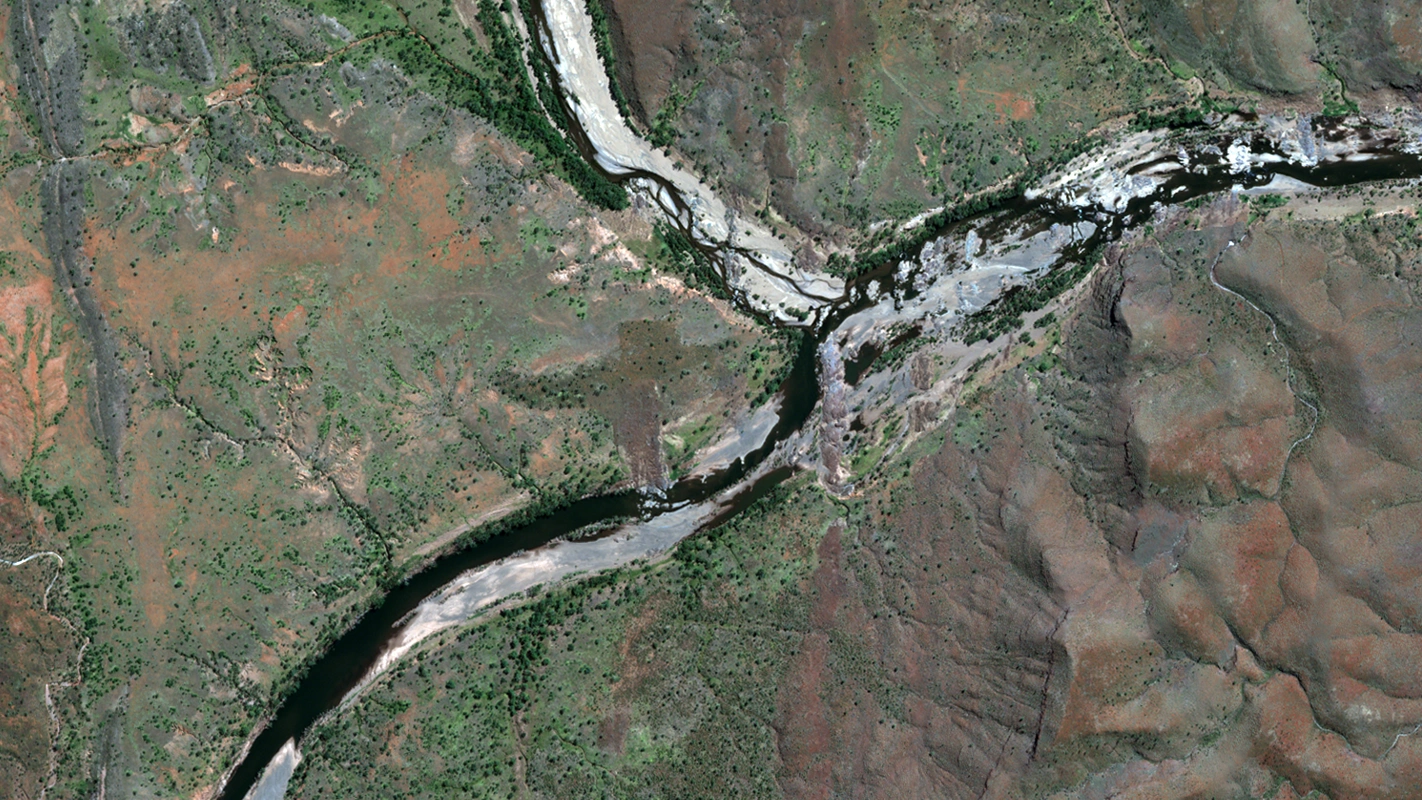
Seeing Beyond Natural Colour
A standard image captures three bands of light: red, green and blue (RGB). Multispectral sensors extend this by capturing additional parts of the electromagnetic spectrum, typically including:
- Blue
- Green
- Red
- Near-infrared (NIR)
- Shortwave infrared (SWIR)
- In some sensors, red-edge bands
Each band captures reflectance at a different wavelength and each wavelength responds differently depending on the material on the ground.
Rather than capturing what something looks like, multispectral imagery helps determine what something is made of and how it is changing over time.
How Multispectral Sensors Work
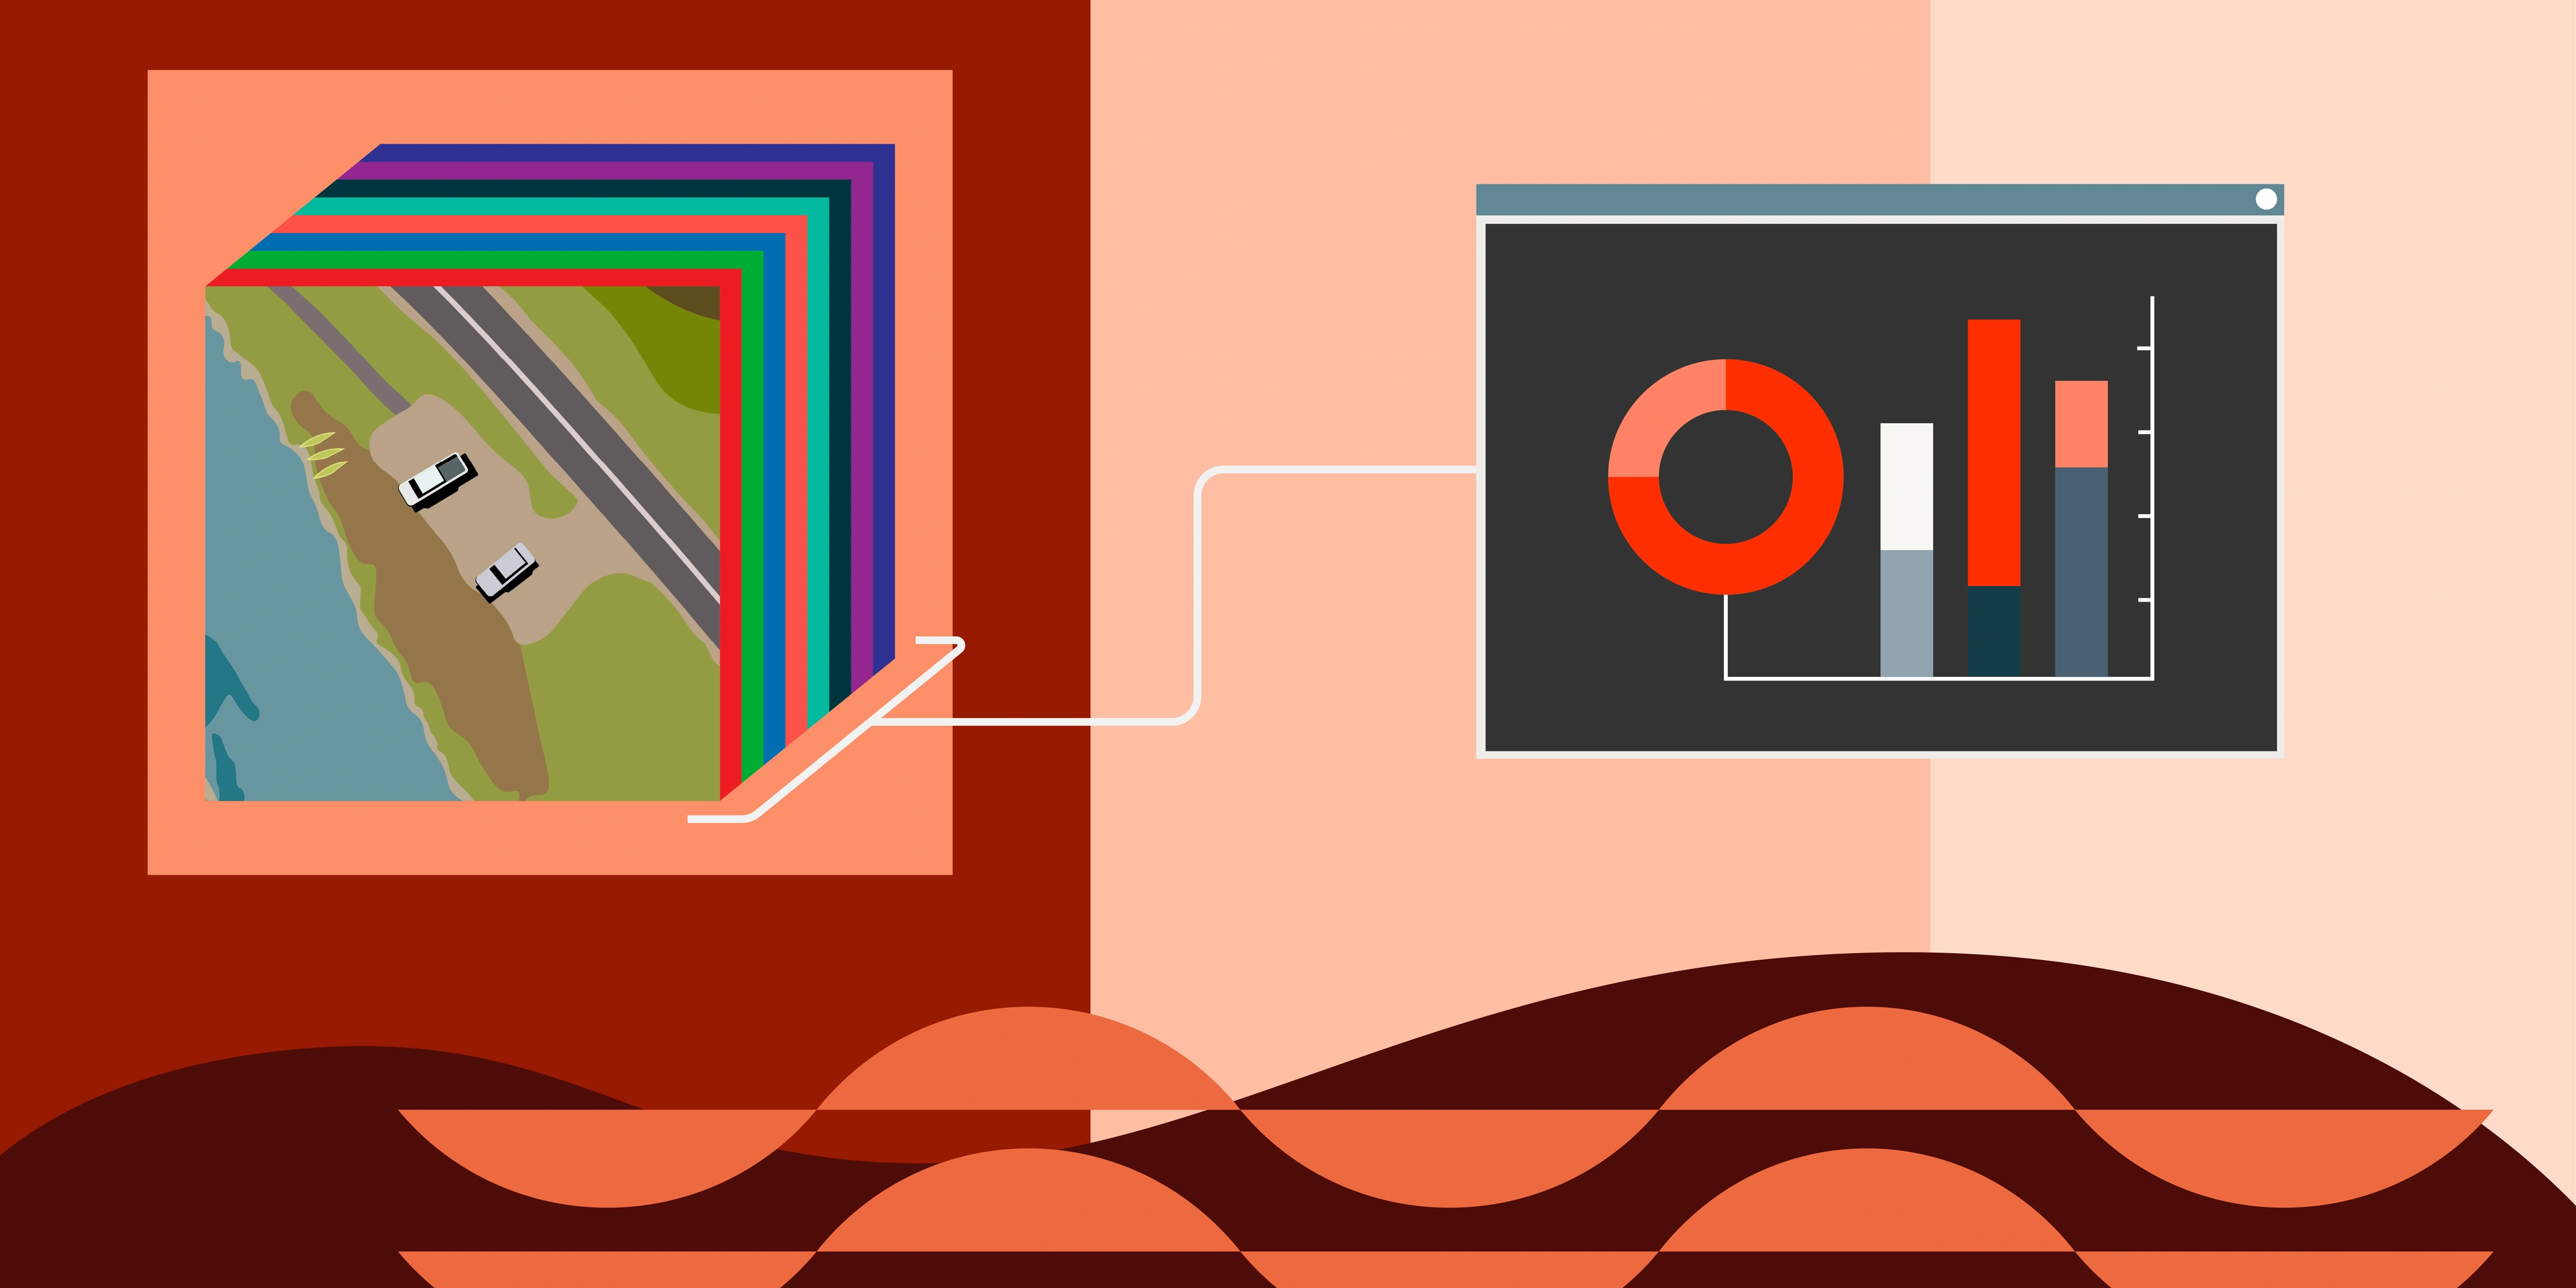
Multispectral satellites do not capture a single photograph in the traditional sense.
Instead, they collect multiple layers of data, each representing a specific wavelength range. These are known as spectral bands.
Each pixel in a multispectral image contains reflectance values across those bands. This allows analysts to:
- Compare spectral responses between materials
- Detect changes over time
- Classify land cover types
- Extract environmental indicators
Each band effectively acts as a different filter on the same location.
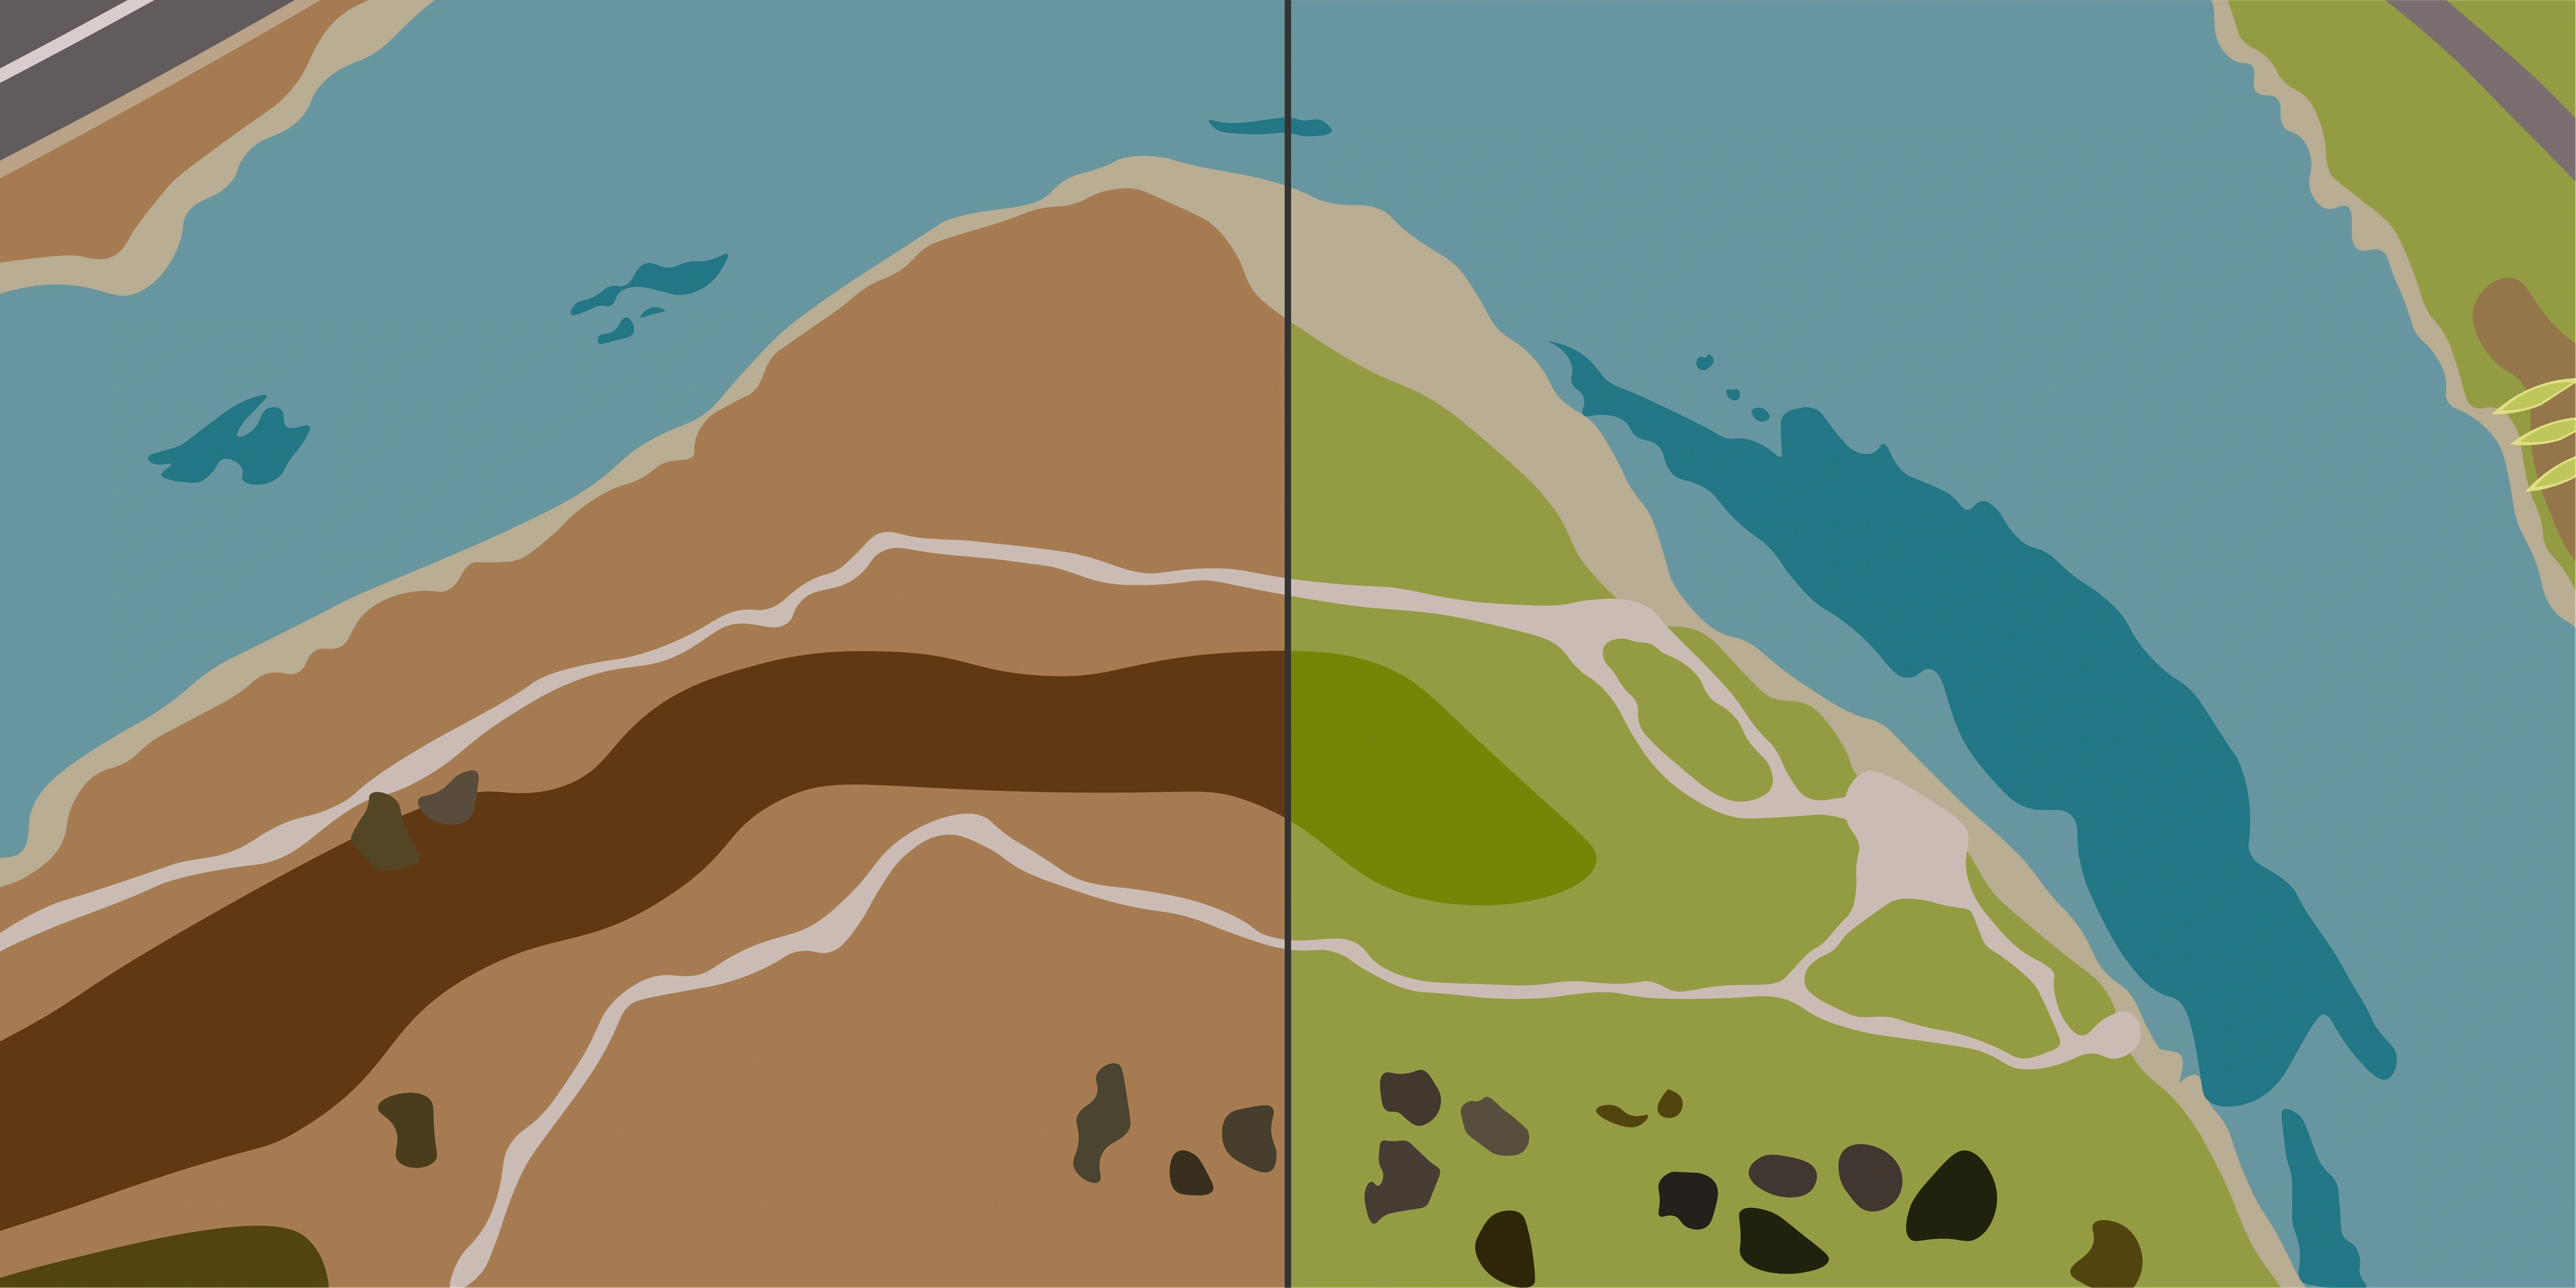
Why Different Materials Respond Differently
Every surface on Earth reflects and absorbs light differently depending on its composition.
Vegetation
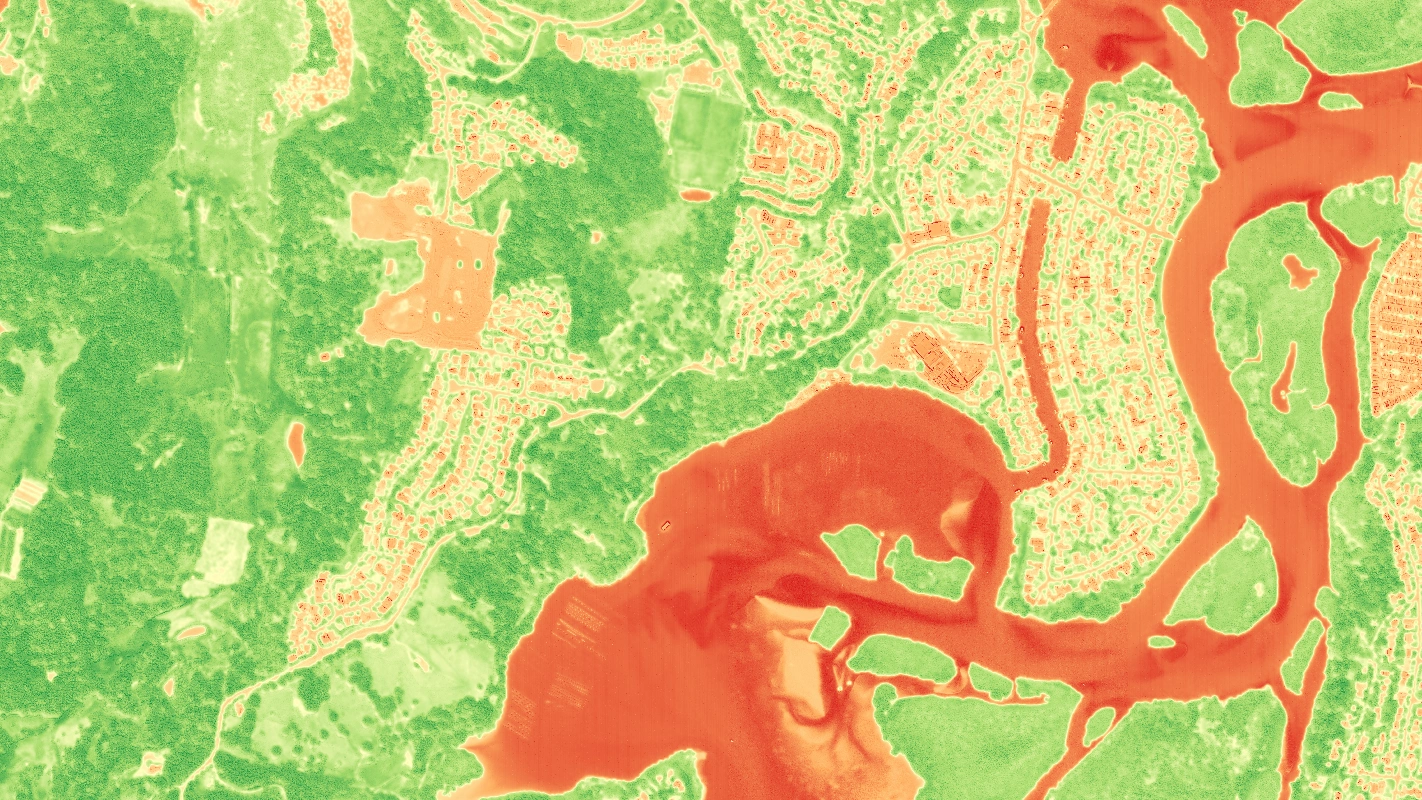
Healthy vegetation reflects strongly in the near-infrared band. This response is the basis for vegetation health monitoring and indices such as NDVI.
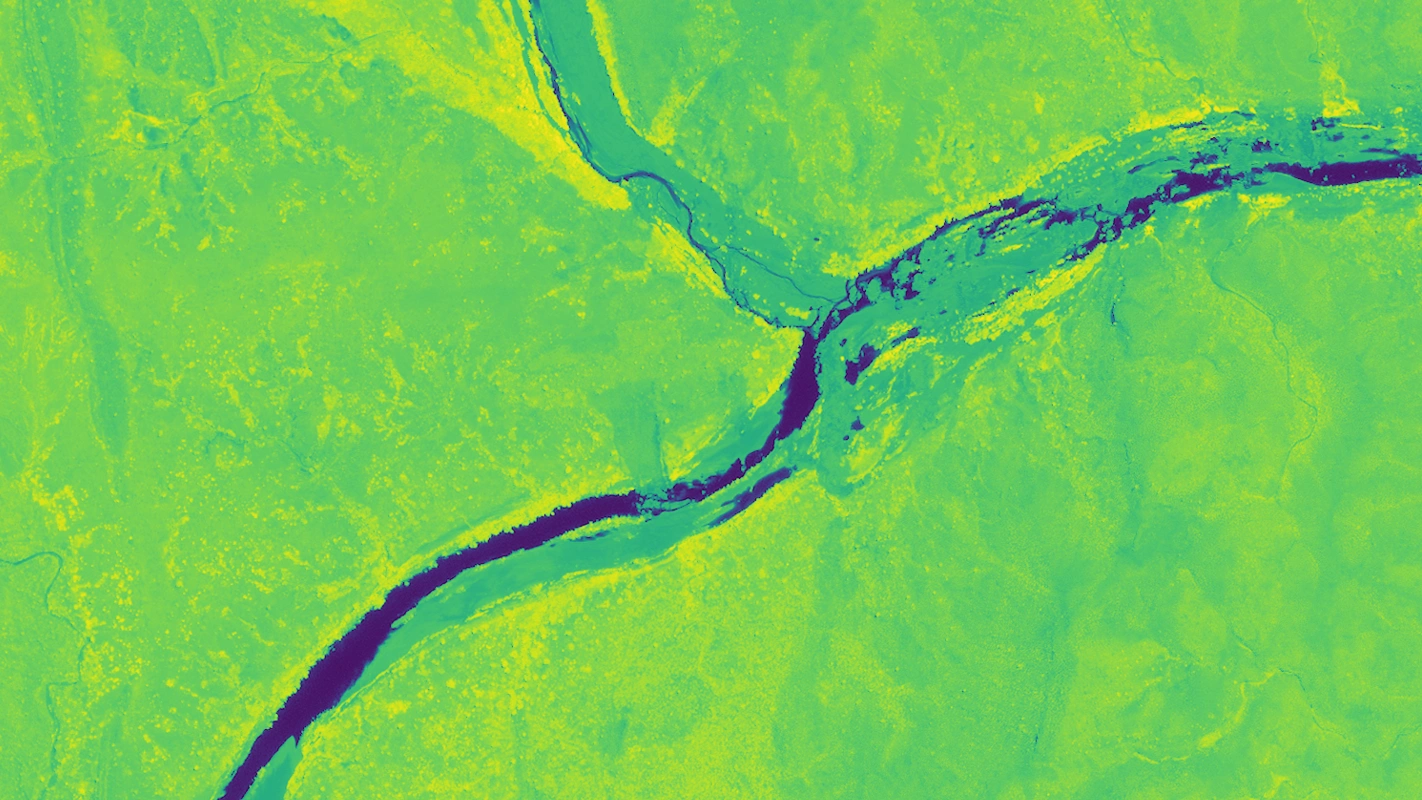
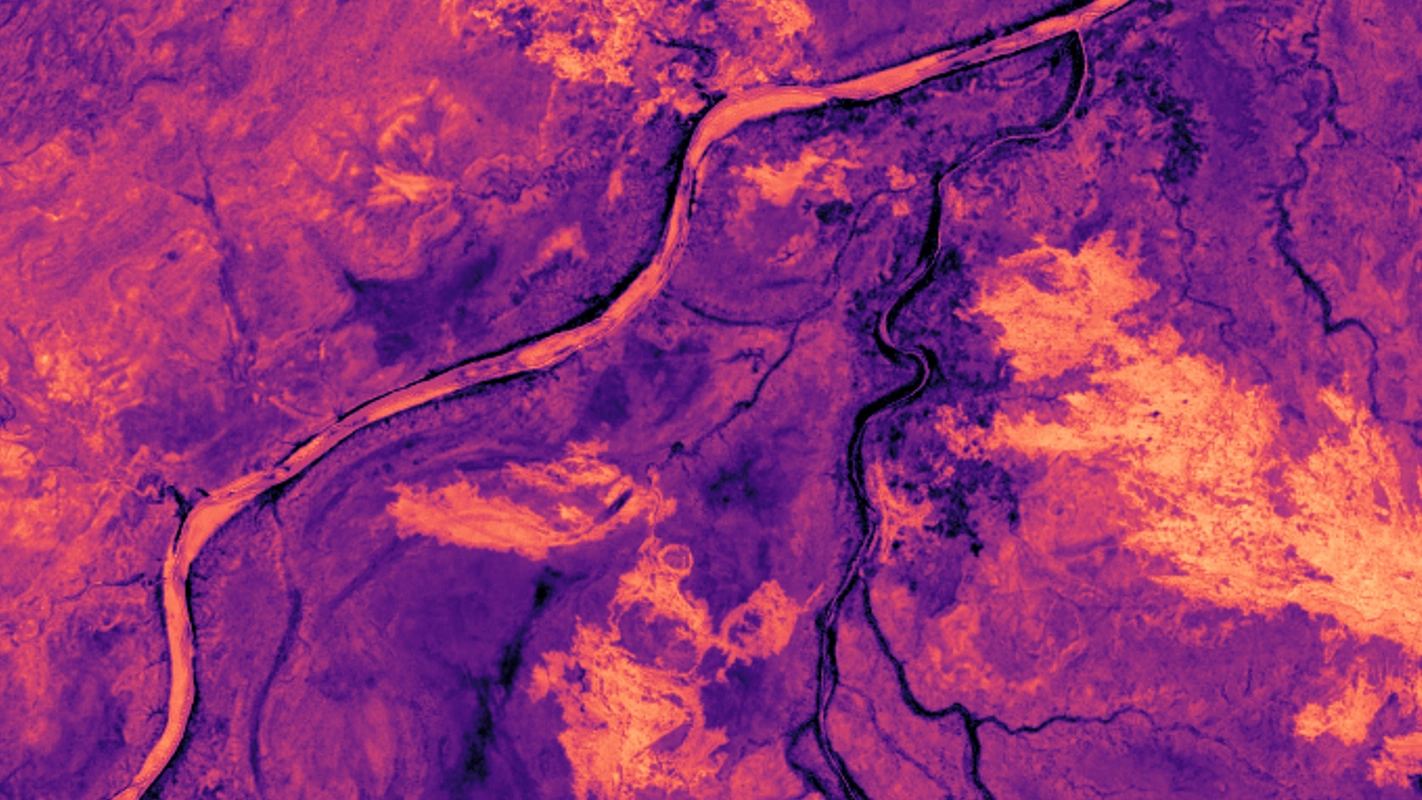
Water
Water absorbs most infrared light, making it appear dark in NIR and SWIR bands. This characteristic is used for flood mapping and water body delineation.
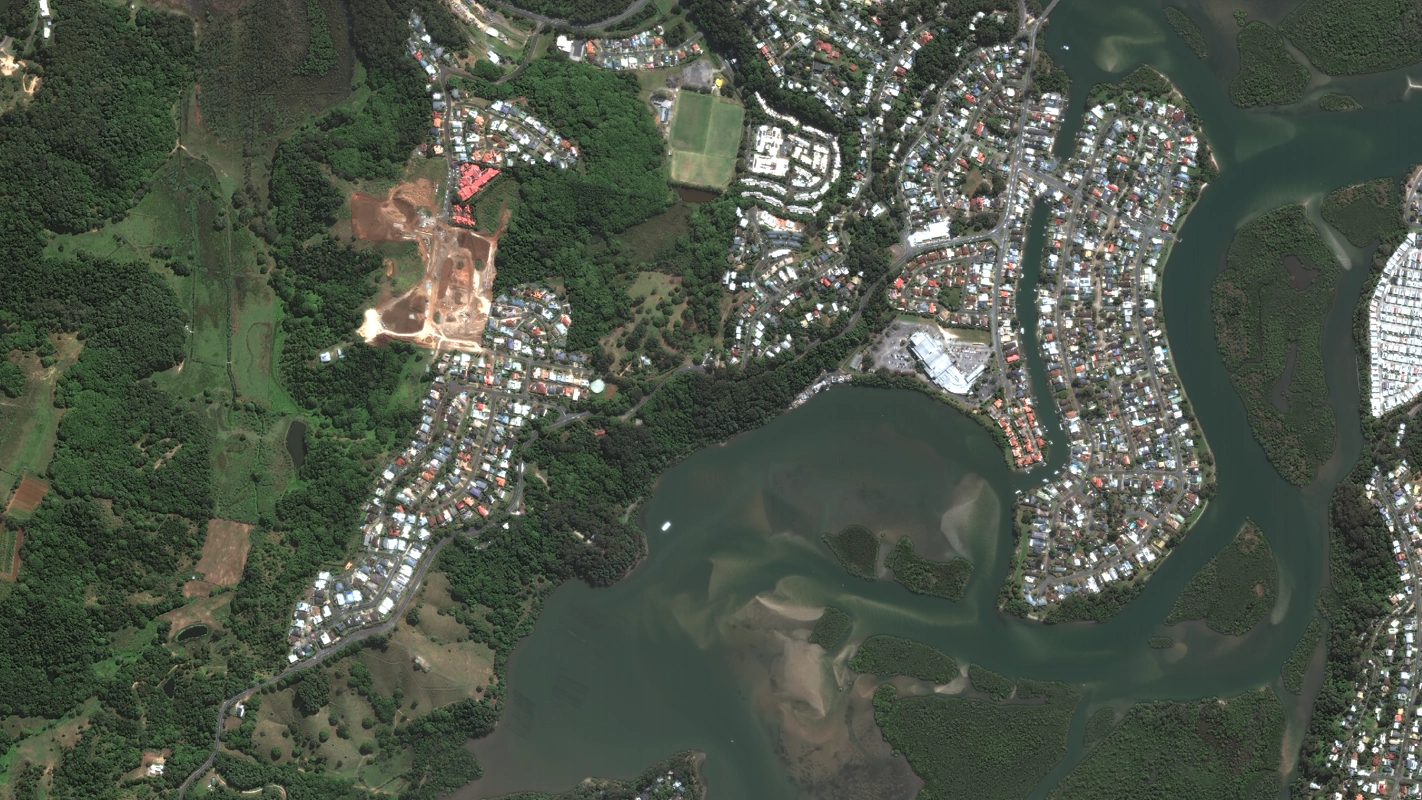
Urban areas
Built environments such as concrete, asphalt and rooftops each have distinct spectral signatures that allow classification of urban land use and change detection.
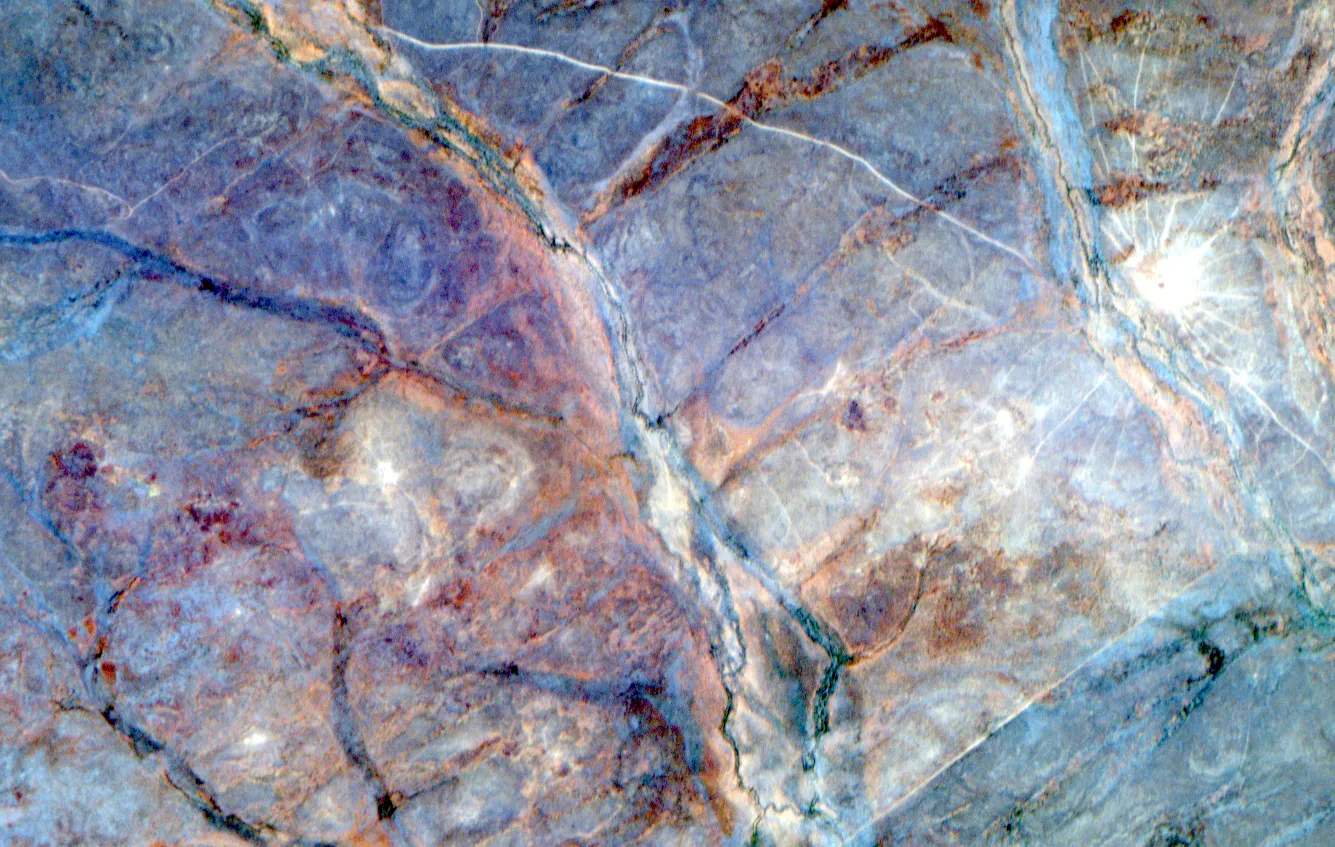
Minerals and soils
SWIR bands are particularly useful in distinguishing soil types and mineral composition, making them valuable in exploration and environmental applications.
This separation of materials is what makes multispectral data operationally valuable.
Multispectral vs Hyperspectral
Multispectral and hyperspectral imagery are often grouped together, but they differ significantly in spectral detail.
| Feature | Multispectral | Hyperspectral |
|---|---|---|
| Number of bands | Typically 4-16 | 100+ narrow bands |
| Spectral detail | Moderate | Very high |
| Data volume | Lower | High |
| Processing complexity | Moderate | High |
| Typical use cases | Mapping, vegetation, water, land cover | Material identification, mineralogy |
Multispectral imagery is the operational standard across most commercial Earth observation systems due to its balance of detail, cost and scalability.
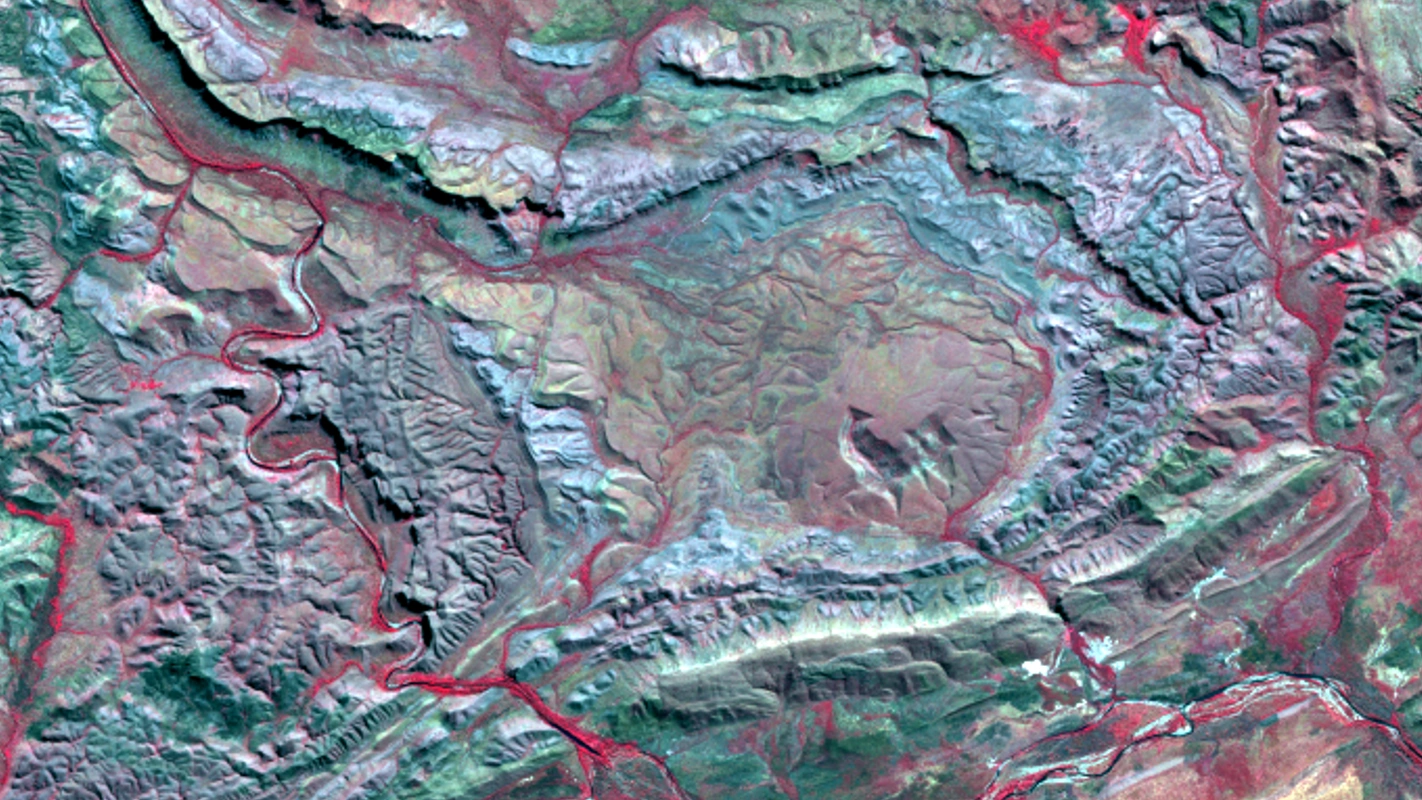
Common Band Combinations
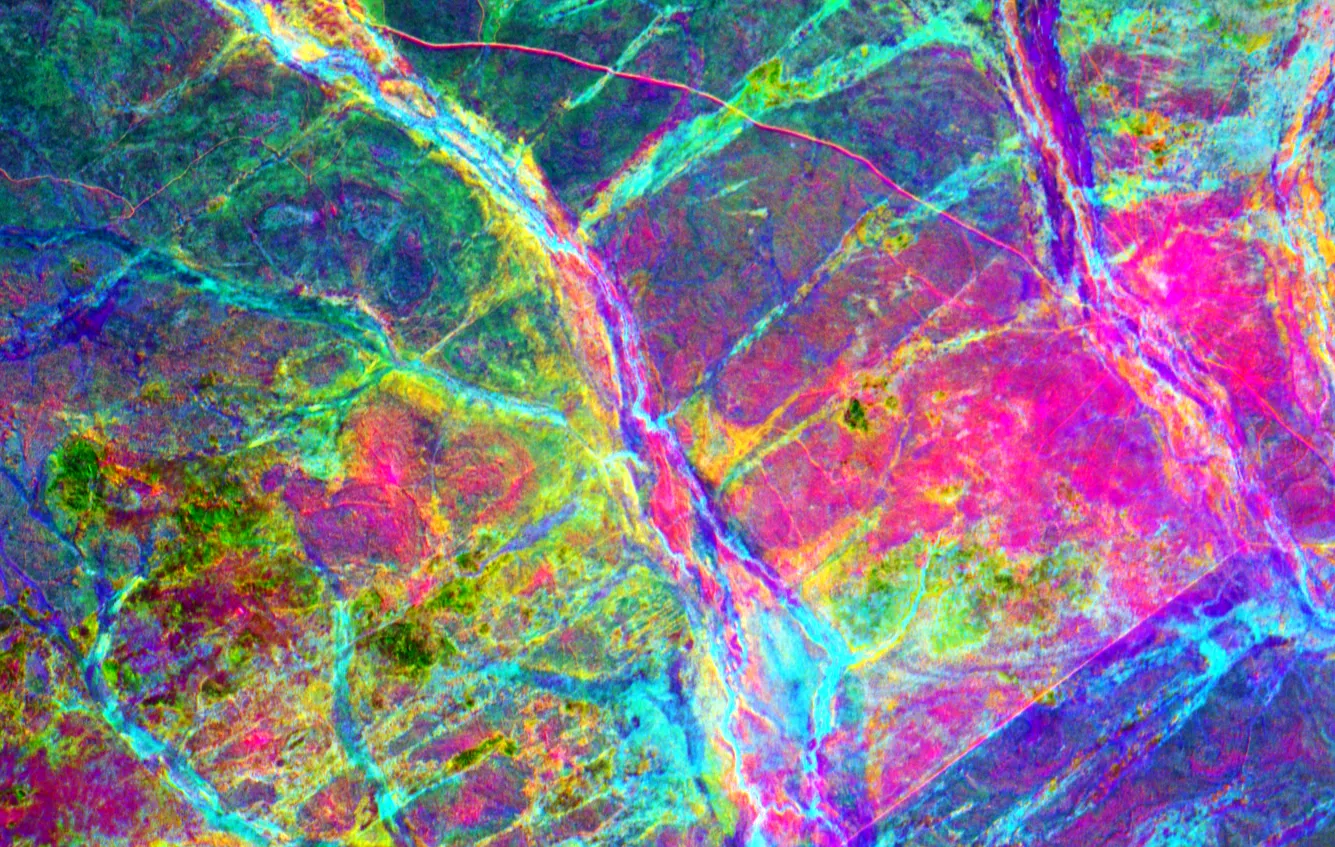
One of the most widely used applications of multispectral imagery is band combination analysis.
By assigning different spectral bands to RGB channels, it is possible to highlight features not visible in natural colour imagery.
Common examples include:
- False colour infrared for vegetation analysis
- Urban composites for built-up mapping
- SWIR combinations for burn scars and soil moisture
- Water-focused composites for flood extent mapping
These combinations are widely used in environmental monitoring, emergency response and resource planning workflows.
Key Applications
Multispectral imagery is used across a wide range of operational sectors:
Agriculture
- Crop health monitoring
- Drought assessment
- Yield estimation
Environmental monitoring
- Deforestation tracking
- Vegetation Classifications
- Water quality assessment
Emergency management
- Flood mapping
- Bushfire burn severity assessment
- Cyclone and storm impact analysis
Mining and resources
- Exploration targeting
- Land disturbance monitoring
- Rehabilitation tracking
Urban and infrastructure
- Urban expansion monitoring
- Construction activity tracking
- Land use classification
Why Multispectral Imagery Is So Widely Used
Multispectral data remains the backbone of operational Earth observation because it offers:
- Broad geographic coverage with frequent revisit
- Sufficient spectral detail for environmental and land analysis
- Scalable data volumes suitable for large-area monitoring
- Established analytical methods and indices
It provides a practical balance between simplicity and analytical power.
Limitations
While highly effective, multispectral imagery has a number of operational constraints that should be considered when designing workflows.
- Limited spectral bands compared to hyperspectral systems
Multispectral sensors capture a smaller number of broader wavelength bands, which limits the level of material discrimination possible compared to hyperspectral imagery. - Dependent on cloud-free optical acquisition
As an optical dataset, imagery quality and availability can be impacted by cloud cover, smoke, haze and atmospheric conditions. - Requires correct band selection and processing
Reliable outputs depend on appropriate band combinations, calibration and processing workflows. Incorrect configurations can lead to misleading interpretations. - Interpretation relies on domain expertise
Spectral responses are not always intuitive and require experience in remote sensing and environmental context to interpret accurately.
Where It Fits in Earth Observation
Multispectral imagery sits at the core of most Earth observation workflows.
It bridges the gap between:
- Standard RGB satellite imagery used for visual interpretation
- Hyperspectral data used for material-level analysis
- Radar systems used for structural and all-weather monitoring
In most operational programs, multispectral data acts as the primary analytical layer for environmental and land-based decision-making.
Final Thoughts
Multispectral satellite imagery is one of the most important and widely used datasets in Earth observation.
It translates reflected light into structured information about the Earth's surface - enabling consistent monitoring of vegetation, water, land use and environmental change at scale.
As satellite constellations continue to expand and revisit times improve, multispectral data will remain central to operational decision-making across government, industry and environmental sectors.