Loading...
Solutions / Industries / Finance & Insurance
The problem
Finance and insurance run on data that is late, incomplete or self-reported. Adjusters arrive days after landfall. Lenders trust borrower updates. Green bond trustees accept annual reports as evidence. By the time the real picture lands, exposure has shifted or funds have been misapplied.
Terrabit delivers satellite imagery so lenders, insurers and sustainable-finance teams can verify what is actually on the ground - a greenhouse going up, a solar farm running, a reforestation project taking hold - without a site visit, at the cadence each line needs.
Where finance and insurance miss the signal
Trigger data is too coarse to reflect actual losses on the ground, so underwriters carry basis risk and payouts miss the loss.
Adjusters take days to reach flood, cyclone or bushfire zones. Loss creep compounds and reserves are set against weak evidence.
Lenders take borrowers at their word, with no independent check that the funded asset is actually being built.
Trading desks wait days for official inventory reports when satellite data could tell the same story in hours.
Who it's for
Reinsurers, underwriters, lenders, commodity desks and sustainable-finance teams - one platform, put to work differently by each desk.
Exposure enrichment, historical event footprint libraries and validation of exceedance-probability curves.
Portfolio-level imagery for property inspection, roof condition, bushfire fuel load and coastal-erosion exposure - no truck rolls required.
Independently verify that loan proceeds are used as stated - milestones reached, greenhouses built, panels installed, crops planted - with a timestamped record of progress on the covenant schedule, no site visit required.
Oil storage tank fills, tanker tracking, dark-fleet detection, crop yield and mine activity - alternative data in hours, not quarterly reports.
Validate green bond and sustainability-linked loan assets from orbit - a reforestation project actually growing, a solar farm installed, the stated crop in the ground. Independent evidence replaces self-reporting.

Capabilities
High-resolution event footprints for flood, cyclone, bushfire and storm, with 50 years of open-data baselines for return-period validation and probable-maximum-loss calibration. The same stack prices exposure asset by asset - bushfire fuel load, flood zones, cyclone corridors and heat stress - refreshed quarterly or on demand after an event.
Damage polygons at property level, delivered straight into ArcGIS and claims-management systems, with radar follow-up where smoke or cloud blocks the optical view. Adjusters go only to the properties where imagery cannot resolve the loss, not the whole portfolio.
When a borrower draws down on a greenhouse, solar farm or infrastructure project, imagery confirms the build is progressing as agreed before the next tranche is released. Tasking tied to covenant milestones gives lenders a timestamped, auditable record of physical progress.
Weekly oil storage-tank fill estimates, refinery throughput, vessel activity at terminals, crop-yield forecasts and mine-activity signals.
One capture, every desk
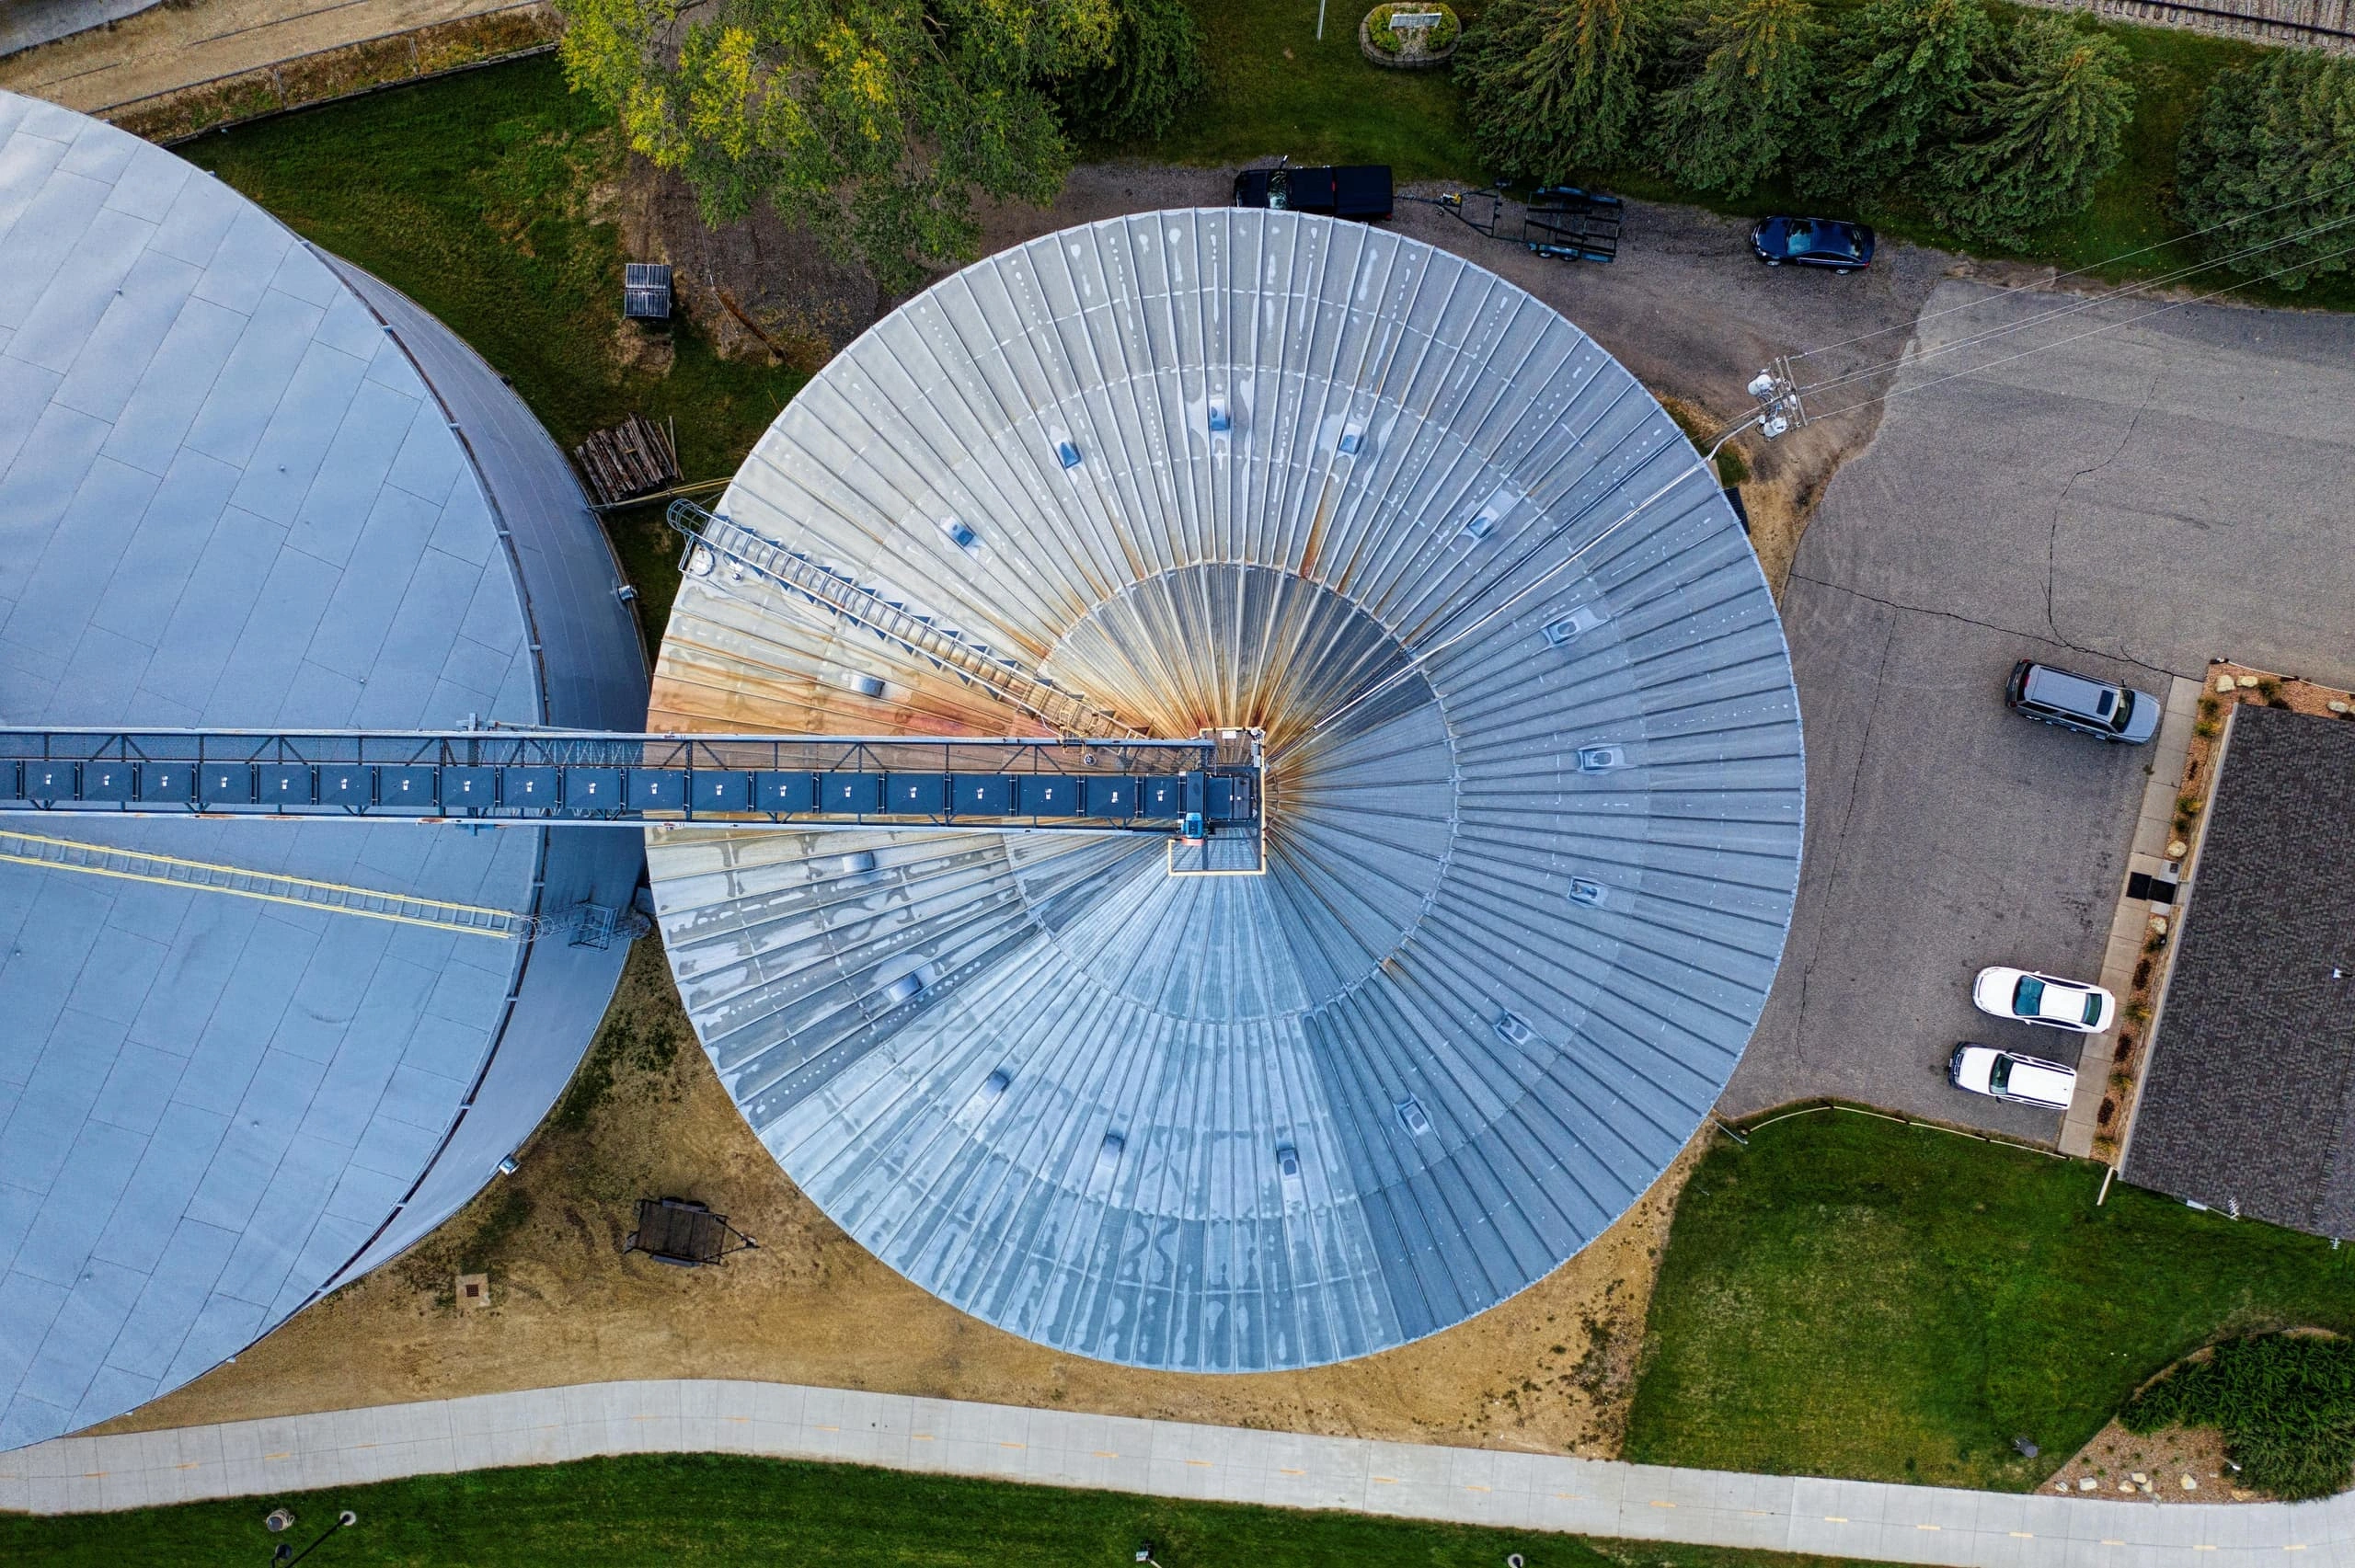
Storage tank fills
Weekly oil-storage estimates and throughput proxies for trading desks and energy analysts.
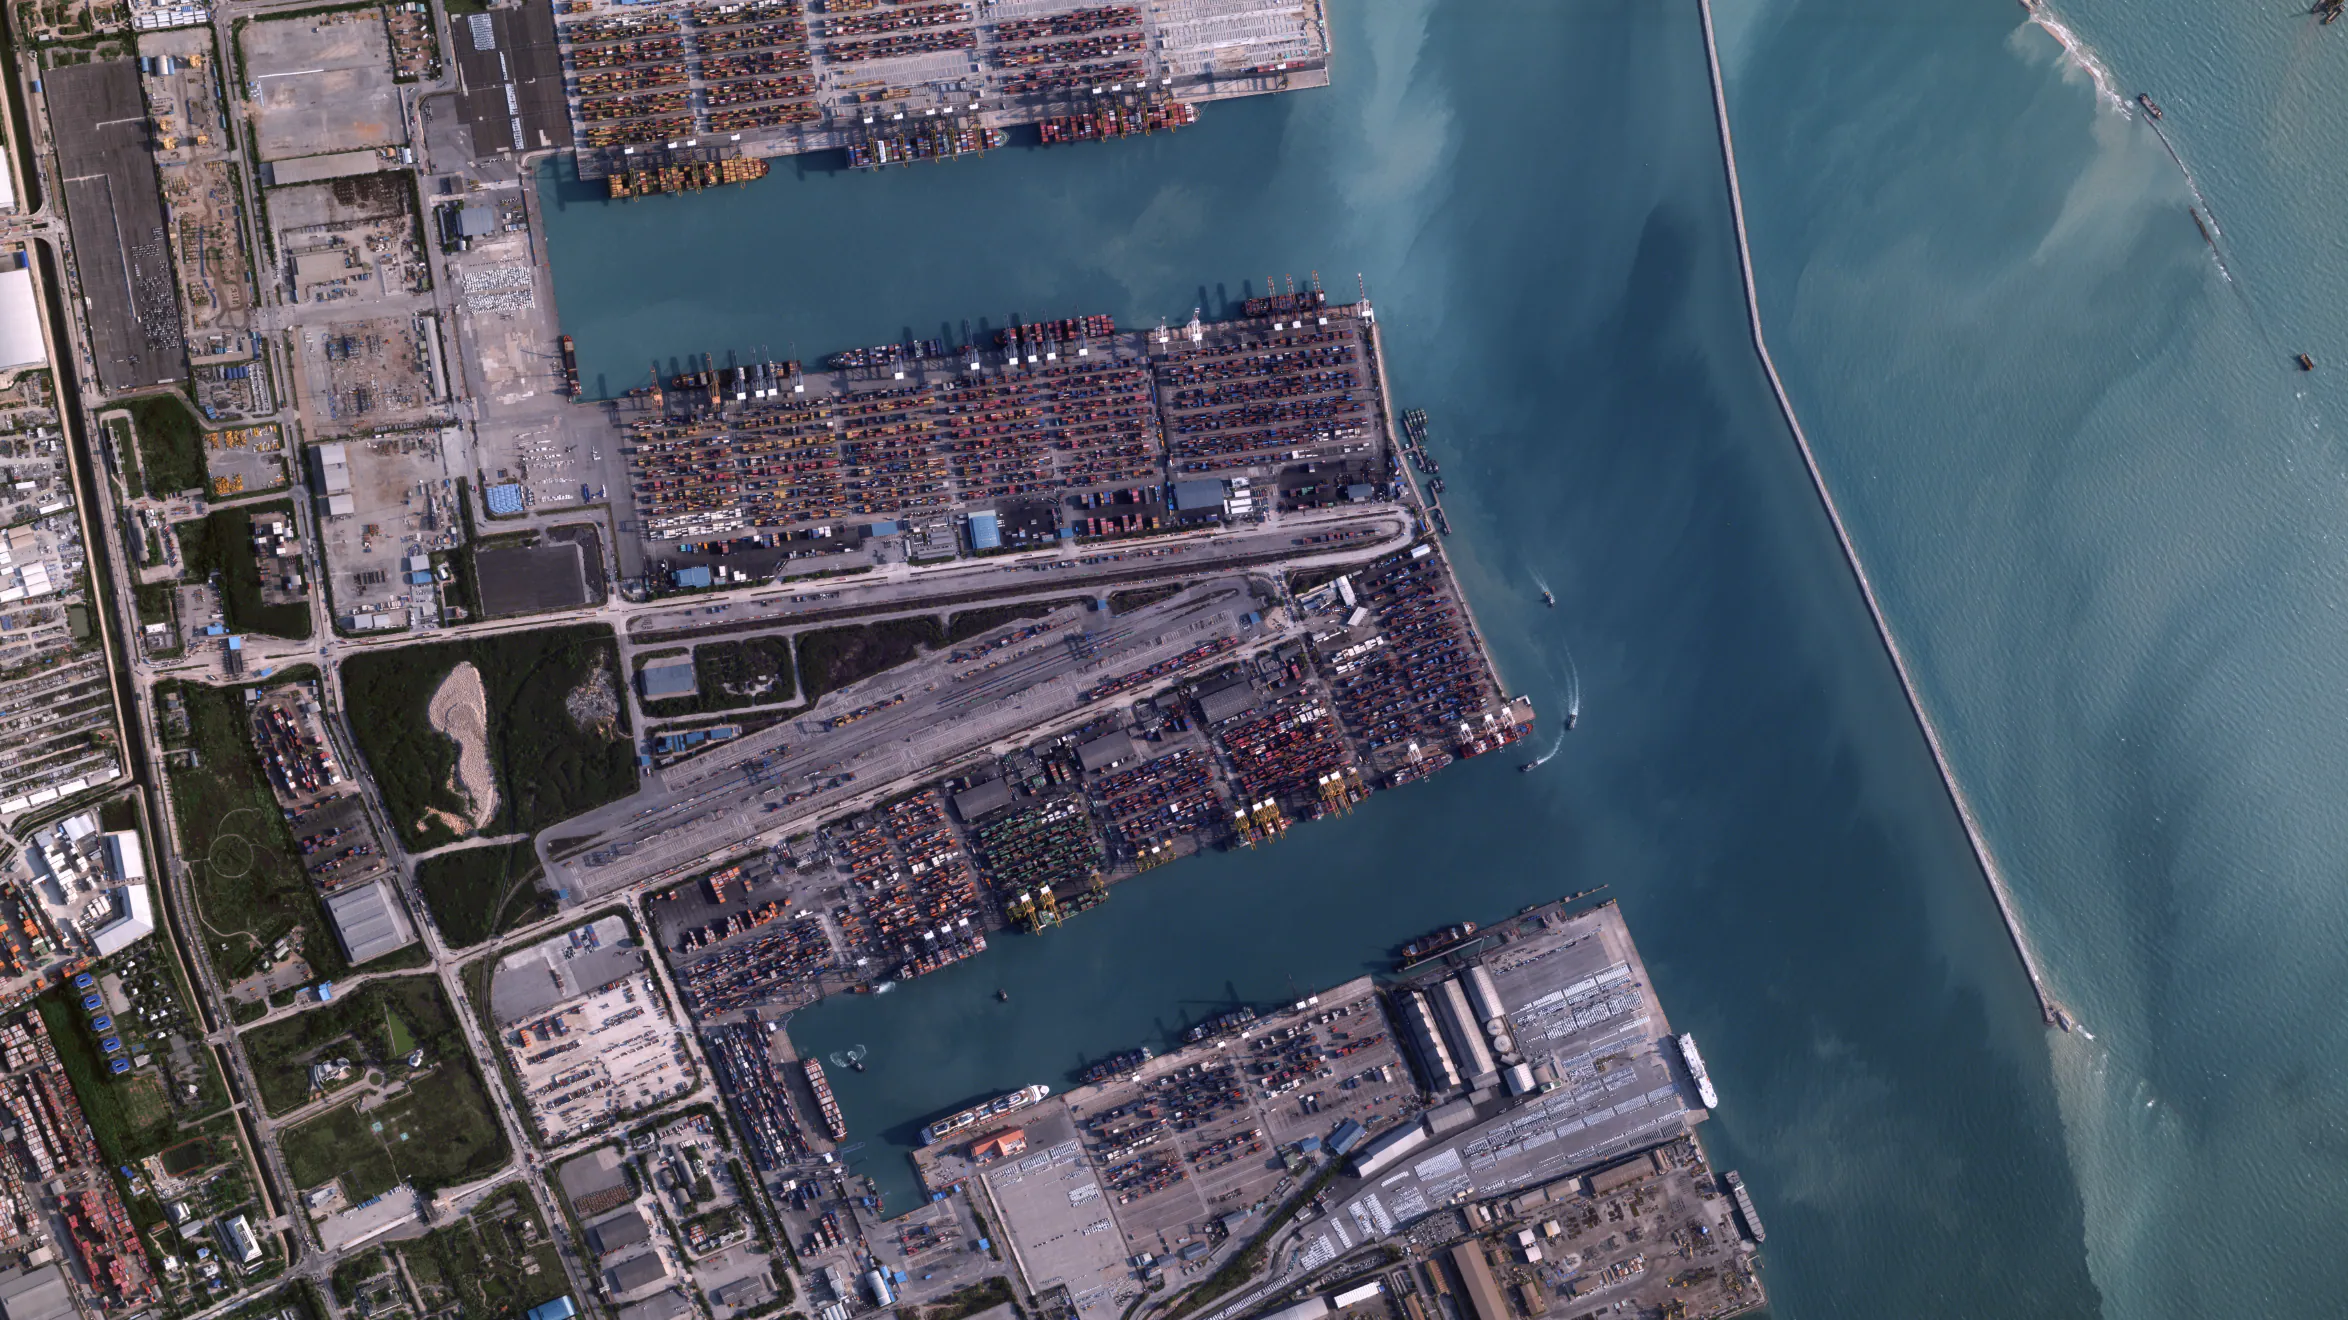
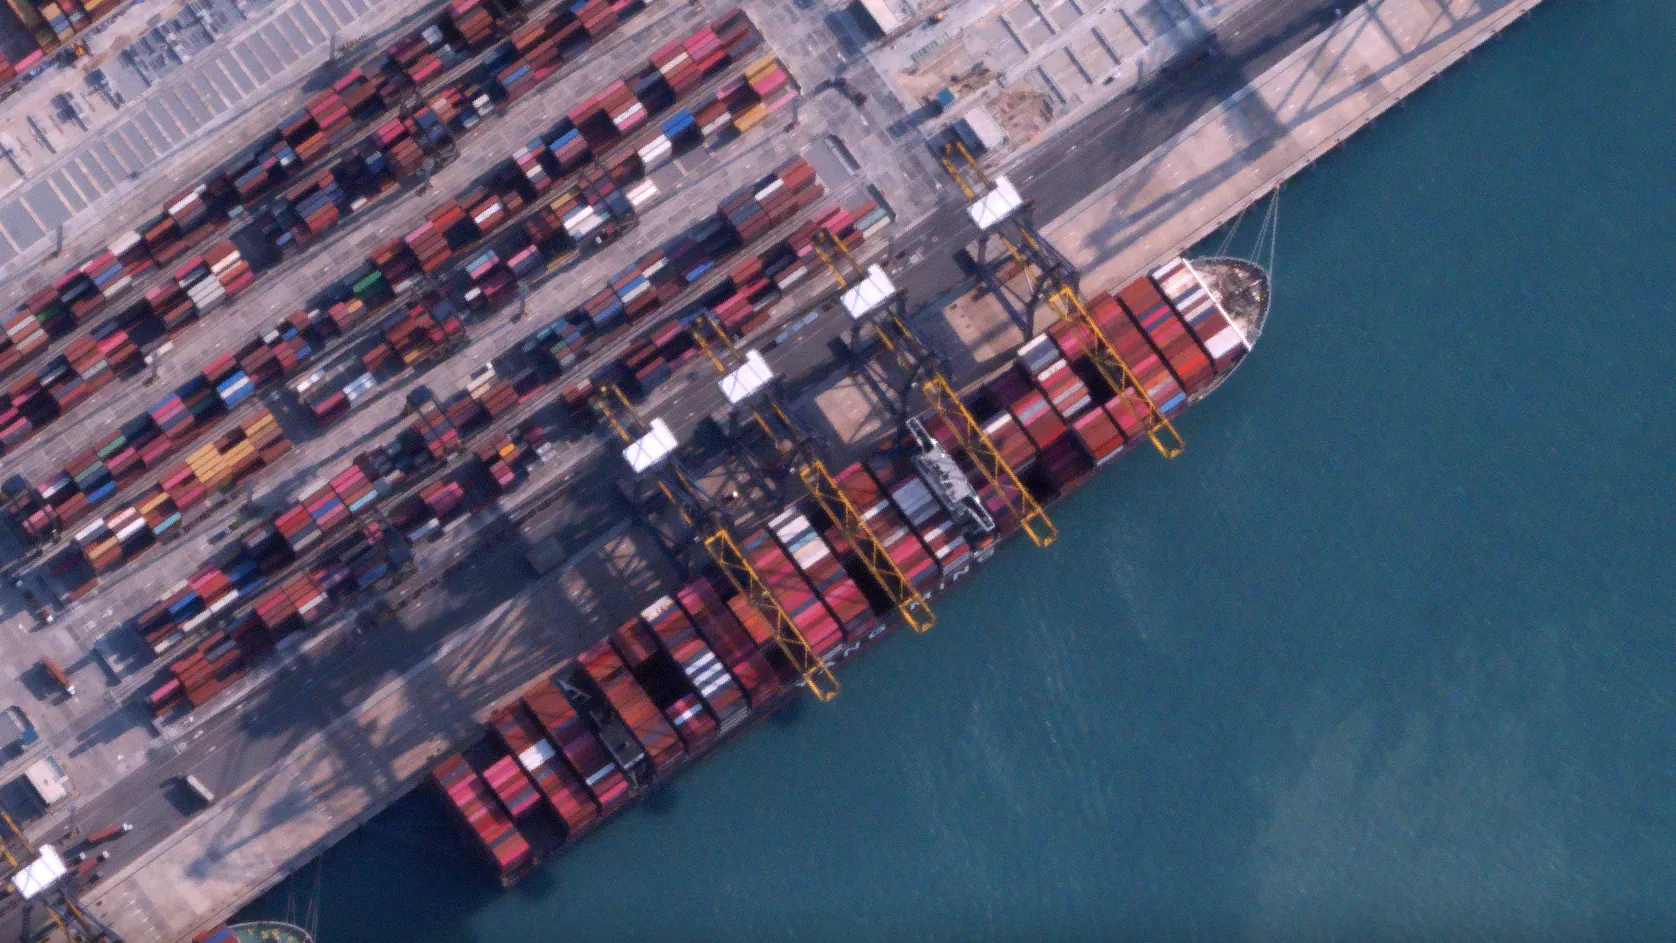
Vessel & trade activity
Berth occupancy, cargo movement and vessel activity - trade signals ahead of official releases.
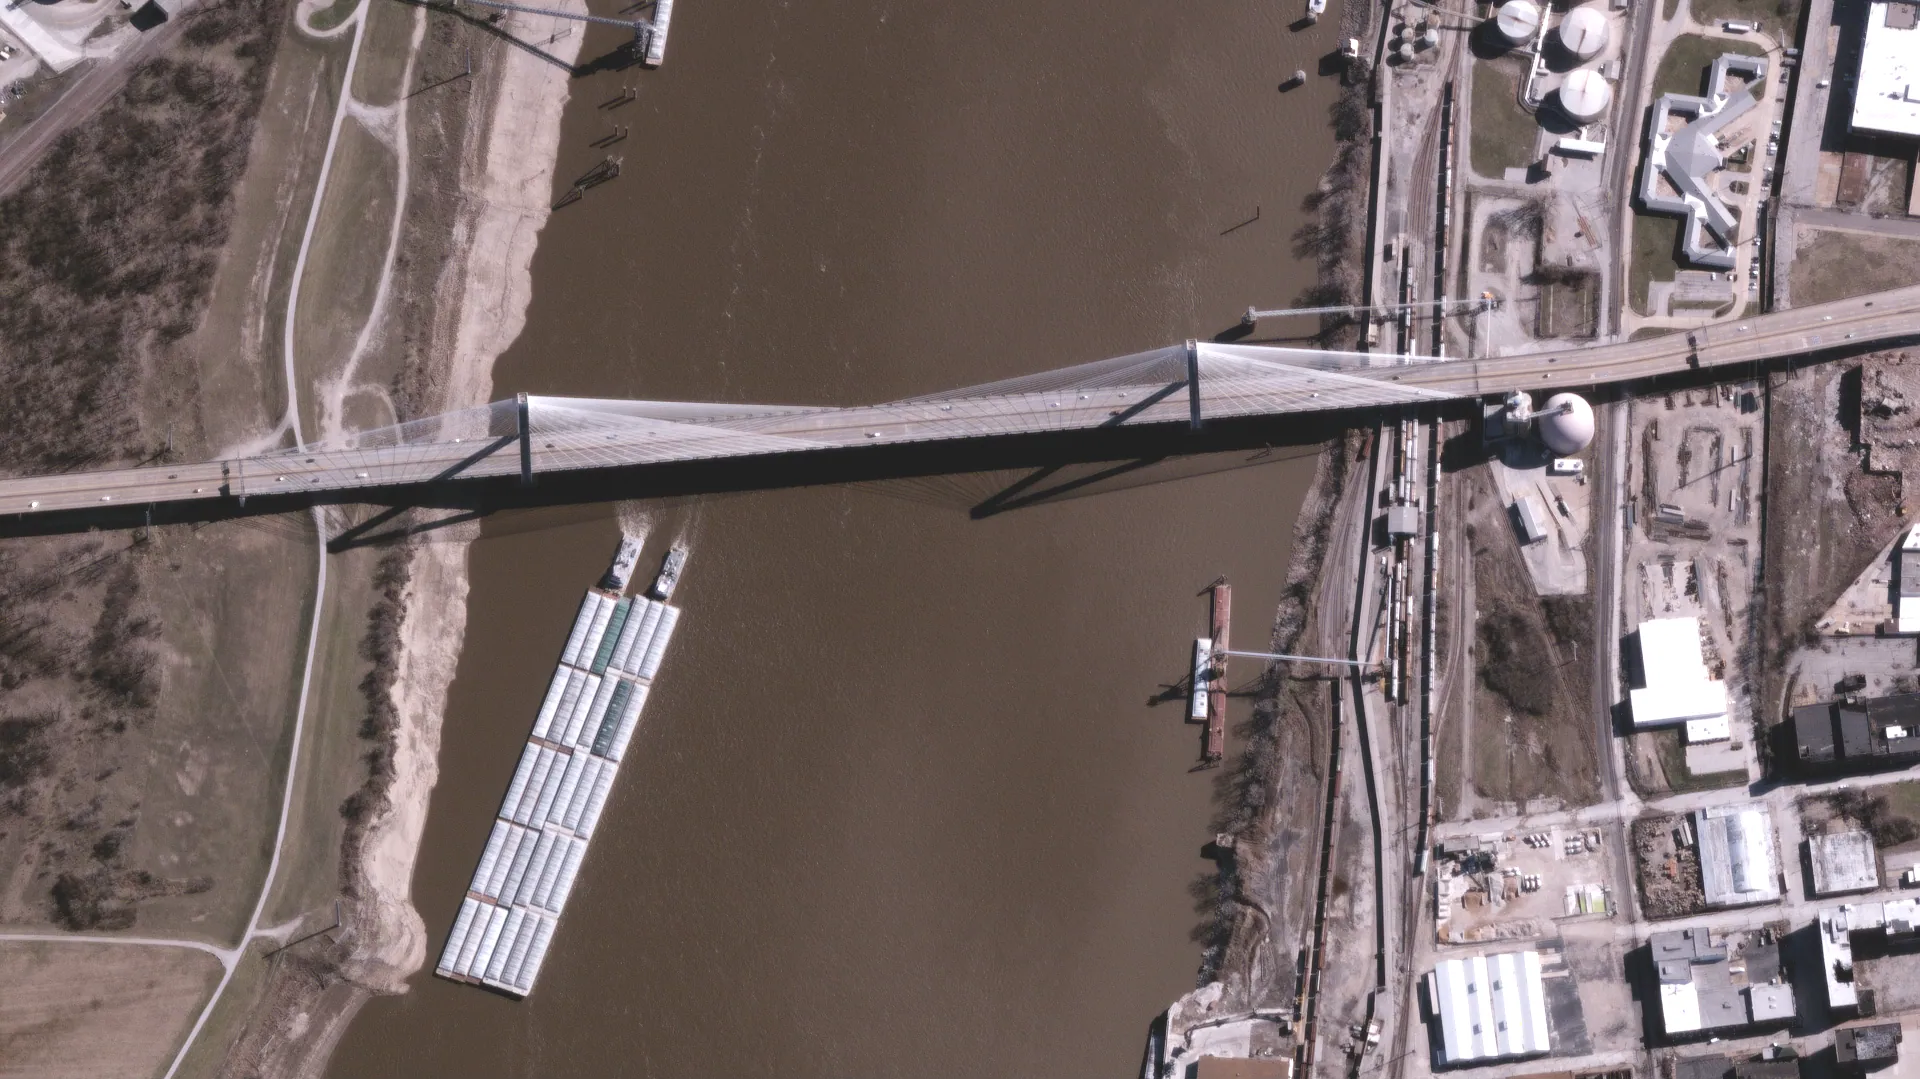
Infrastructure change
Refinery turnarounds, terminal expansion, construction progress - covenant and collateral evidence for lenders.
Post-event damage
Rapid analysis-ready optical for hurricane, flood and fire damage assessment.
In the field
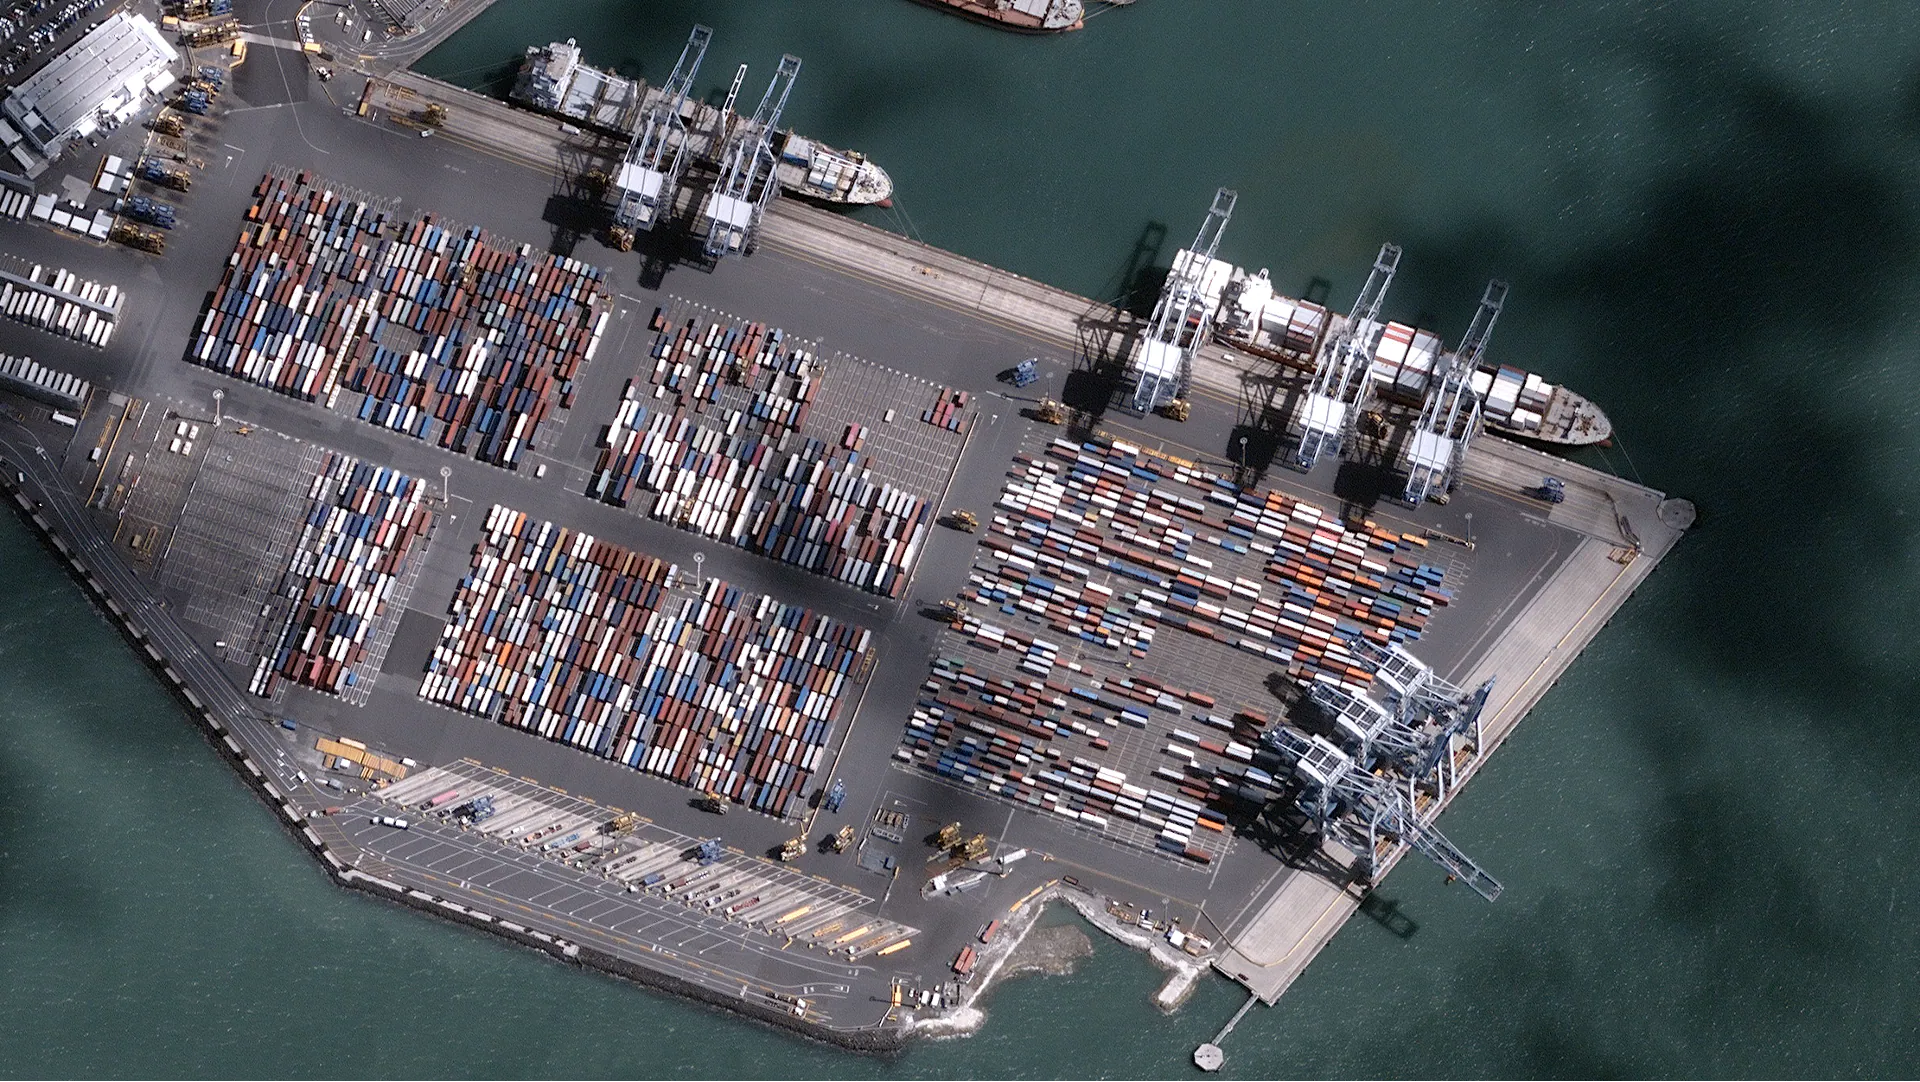
High-resolution optical · 6 Mar 2025
Trade signal · container vessel
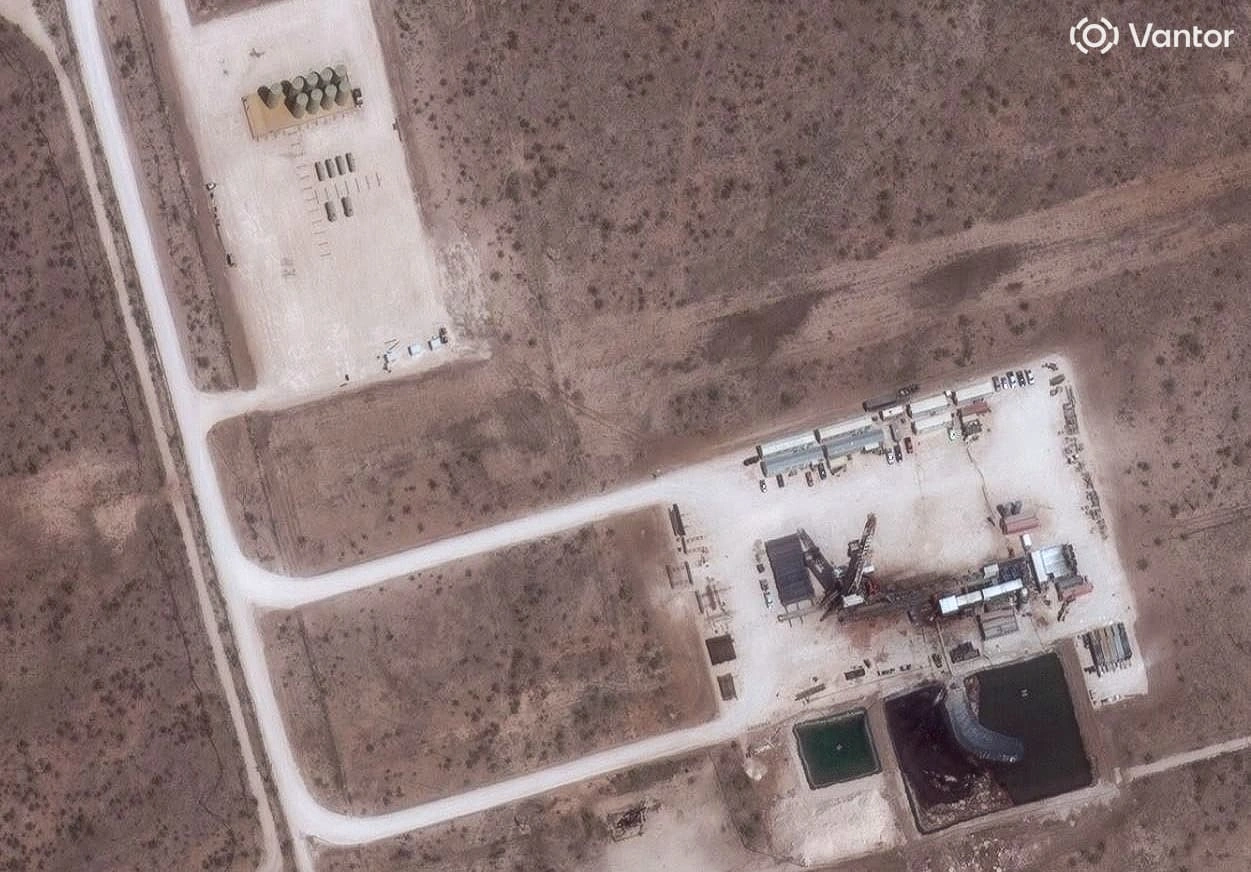
High-resolution optical · 3 Apr 2025
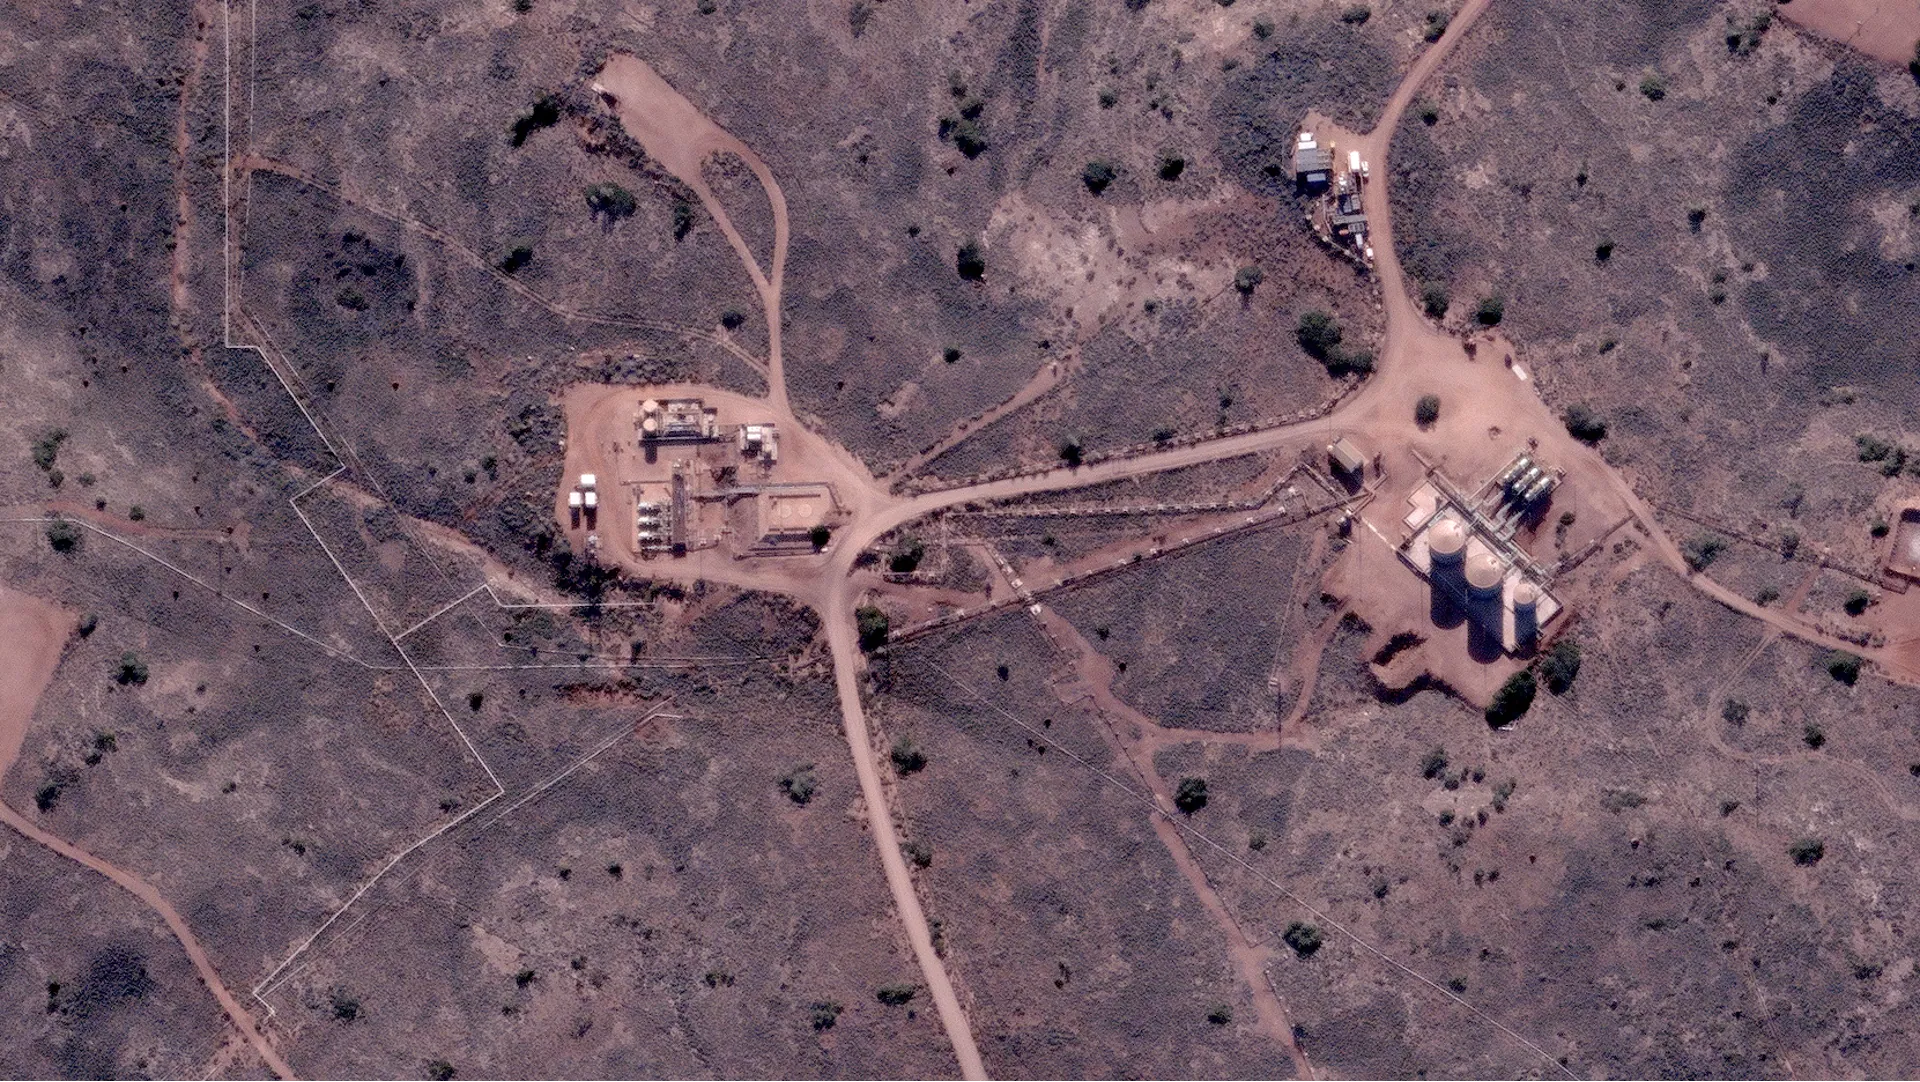
Commodity · Permian wellpad activity
High-resolution optical · 16 Mar 2025
Collateral · infrastructure asset
Lifecycle
Three stages of the insurance-and-finance cycle, all served by the same tasking pipeline - from exposure enrichment at bind through portfolio monitoring to post-event claims.

01
Exposure enrichment at bind - property condition, bushfire fuel load, flood zones and cyclone corridors feeding CAT models and parametric trigger design.
02
Track loan use and portfolio assets on the cadence each line needs - drawdown checks monthly, commodity feeds weekly, disclosure refresh quarterly - replacing self-reported updates with independent evidence.
03
Rapid post-event evidence - damage assessment and parametric trigger validation within the payout window.
Data & methods
Every capture arrives fully processed - colour-balanced, orthorectified, atmospherically corrected and pansharpened - in the formats your risk, actuarial and quant teams already run.
How it works
Same pipeline, same provenance - every line, every portfolio.
Outputs
The concrete products finance and insurance teams receive across underwriting, monitoring, claims and disclosure.
Platform
Coordinate imagery, elevation and specialised data tasking across underwriting, claims, commodity and disclosure workflows, with centralised budgets, multi-team access and audit-ready archives.
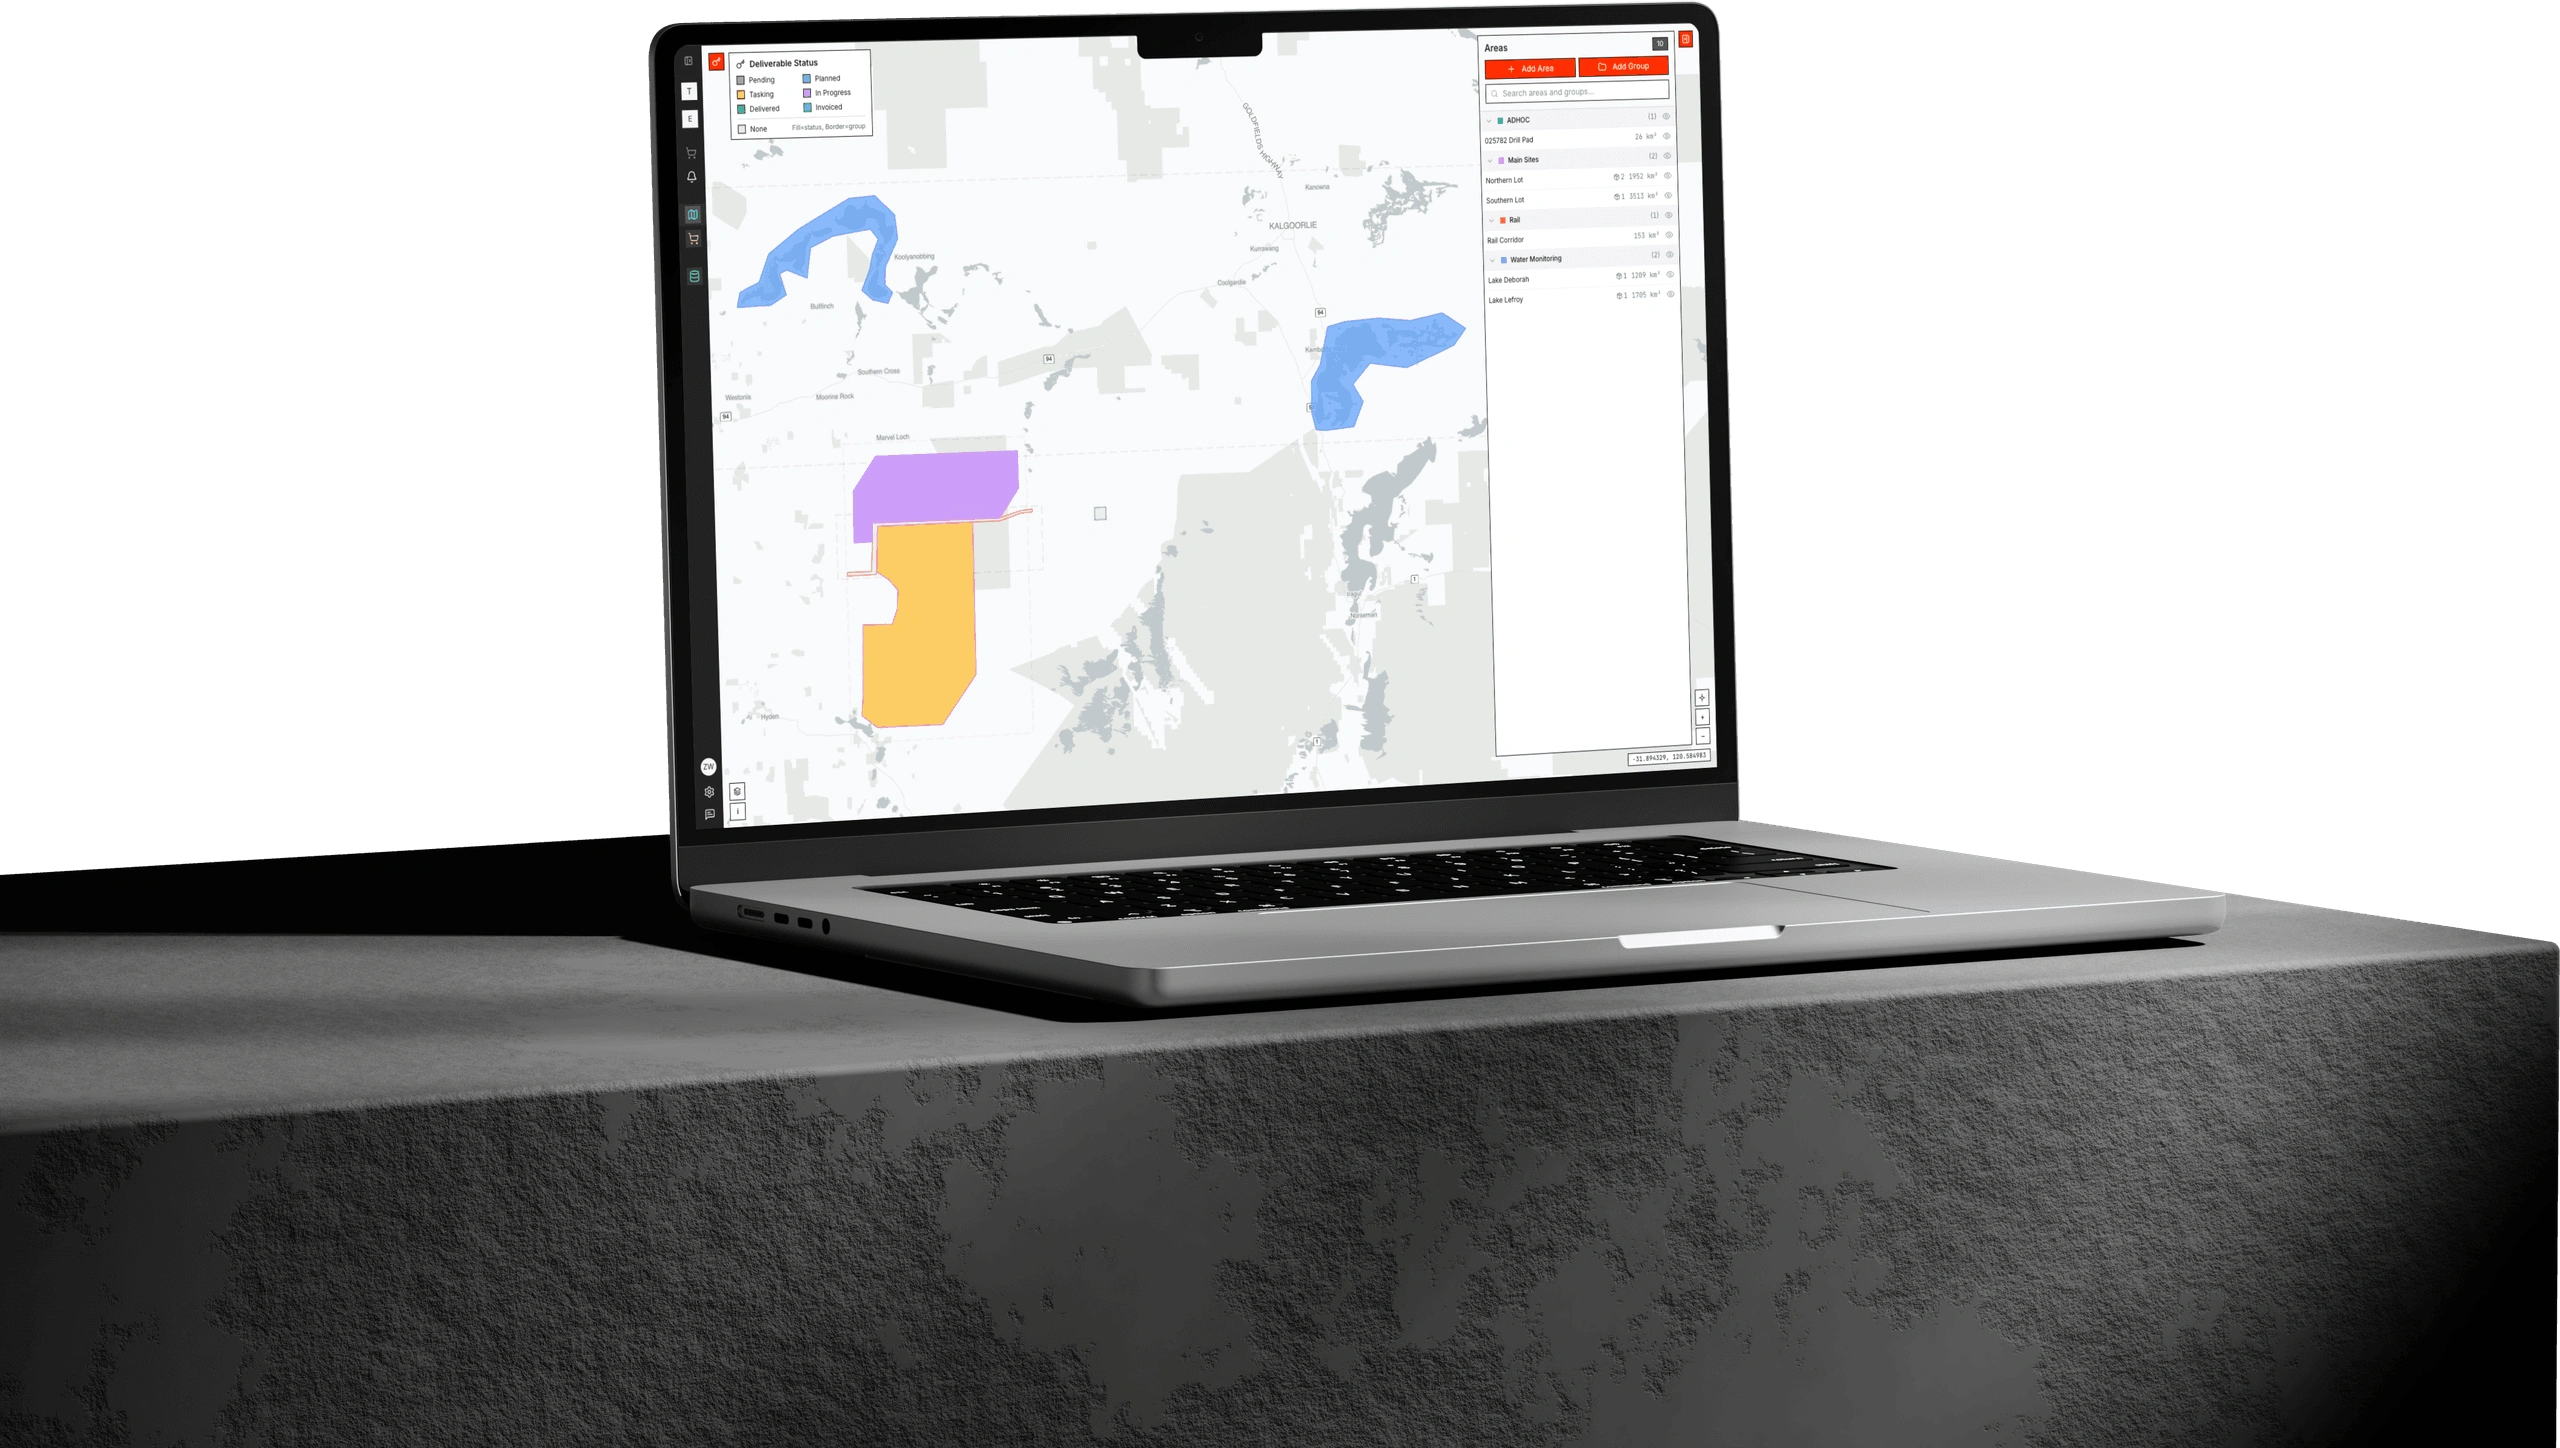
Albatross is where every desk orders and manages satellite data. Submit tasking, approve budgets, track deliveries and keep a timestamped spatial record, from post-event damage packs and parametric trigger feeds to weekly commodity data.
Products
Products
Analysis-ready optical and multispectral imagery for catastrophe modelling, claims triage, commodity alt-data and physical-risk disclosure, delivered in the exposure formats your stack runs.
Products
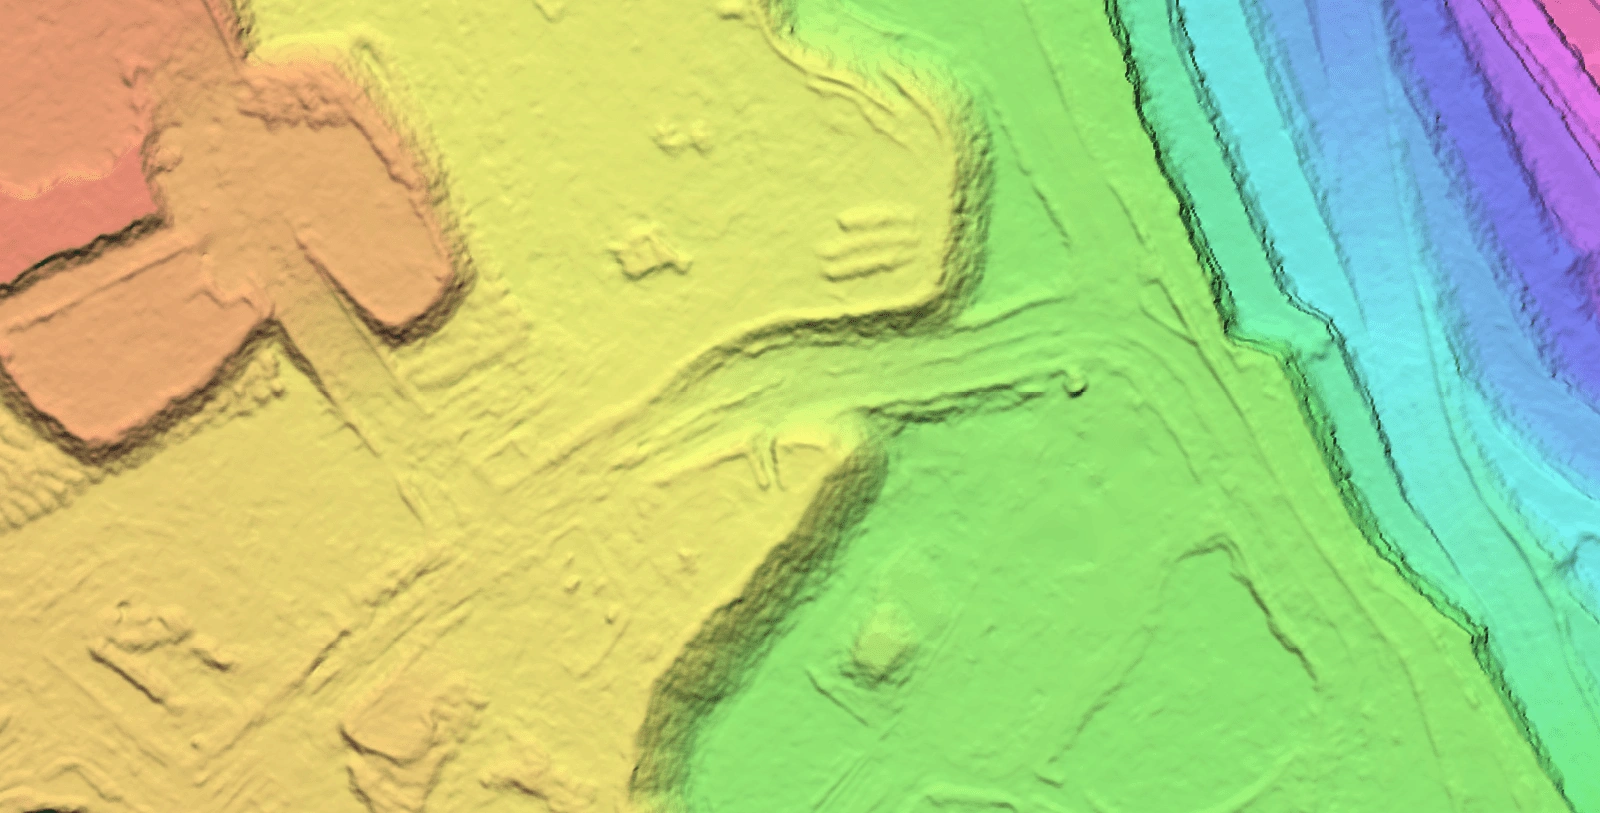
Elevation products from 0.5m to 5m resolution for flood modelling, coastal-erosion exposure, bushfire terrain and asset baselines, aligned to GDA2020.
Talk to the team about satellite data for your desk, from catastrophe modelling and claims triage to commodity signals and physical-risk disclosure.