Environmental monitoring has become one of the most demanding and high-value applications of satellite imagery. Governments, consultancies, NGOs and resource companies increasingly rely on Earth observation data to track deforestation, vegetation health, water quality, land disturbance and ecosystem change.
But choosing the right satellite data for environmental projects is not straightforward. With dozens of sensors, varying resolutions, multiple spectral bands and differing revisit rates, it’s easy to end up with data that doesn’t quite fit the analysis at hand.
This guide explains how satellite imagery can be used effectively for environmental monitoring, what types of data work best for different applications and how to avoid common pitfalls when planning an Earth observation program.
Why Satellite Imagery is Transforming Monitoring
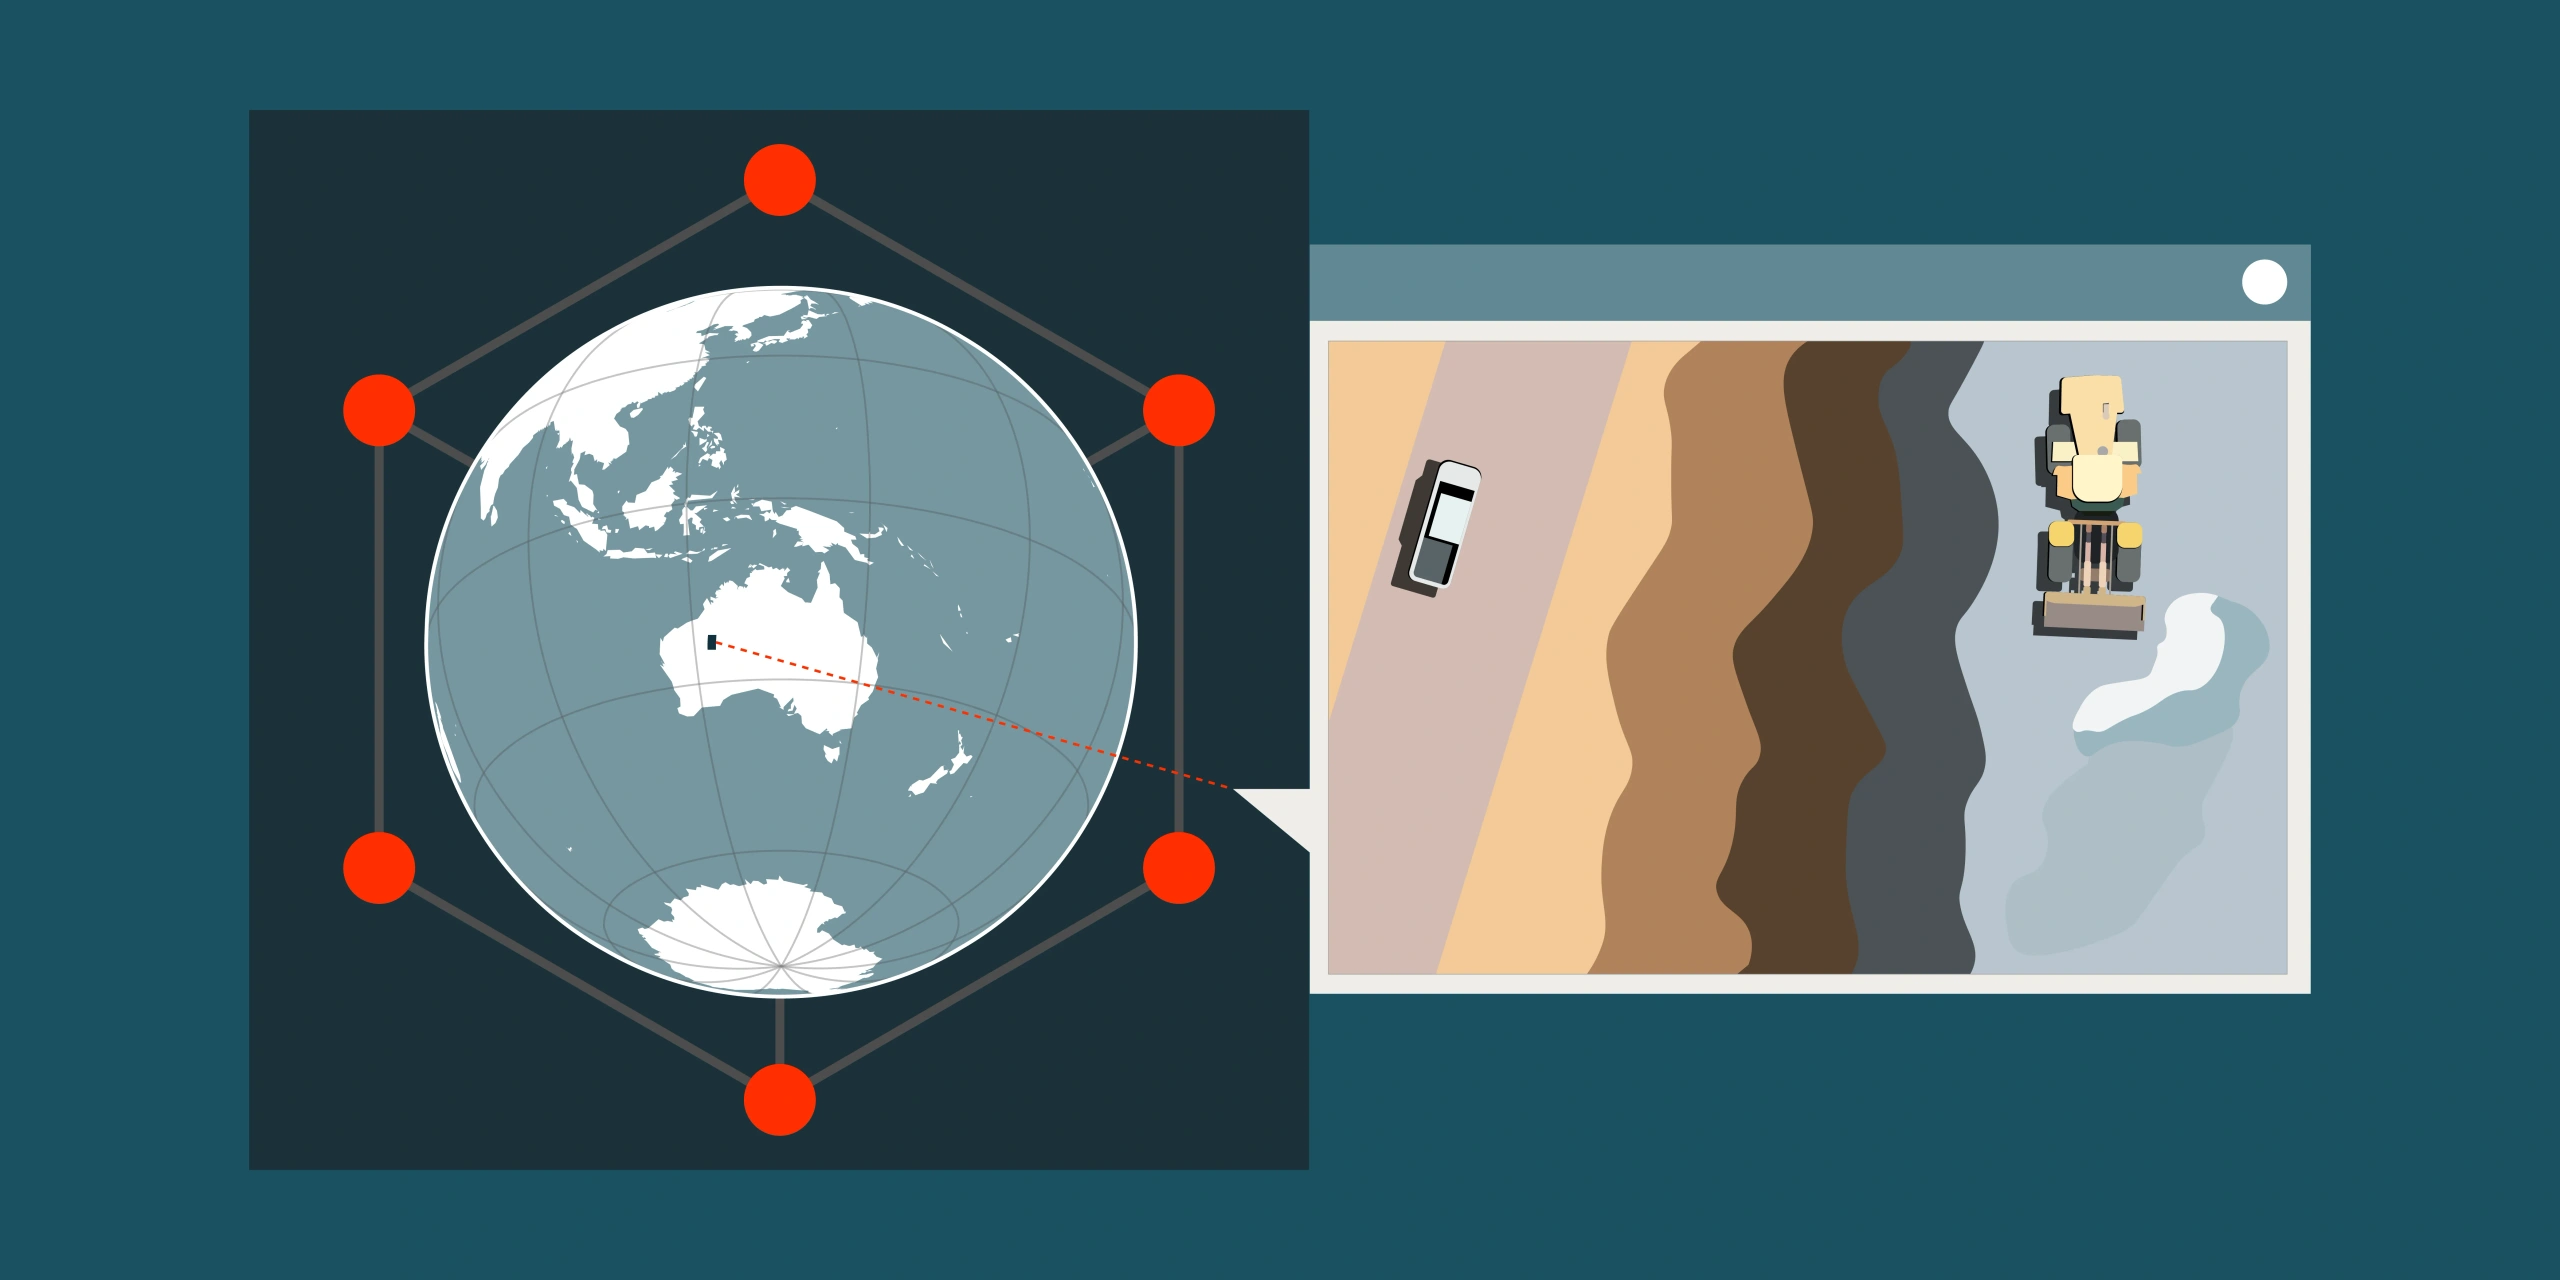
Australia’s vast distances, challenging terrain and remote ecosystems make field-based environmental monitoring expensive and logistically difficult. Satellite imagery provides a consistent, repeatable and cost-effective way to monitor large areas over time without needing to send people into the field every month.
Key advantages include:
- Coverage: Satellite imagery captures entire regions, catchments or mining leases, providing context that ground surveys often miss.
- Frequency: Modern satellite constellations can revisit the same area multiple times per week, enabling timely detection of changes such as algal blooms, illegal clearing or rehabilitation progress.
- Historical baselines: Archive imagery going back decades allows analysts to understand long-term trends, such as mangrove loss, urban expansion or seasonal vegetation cycles.
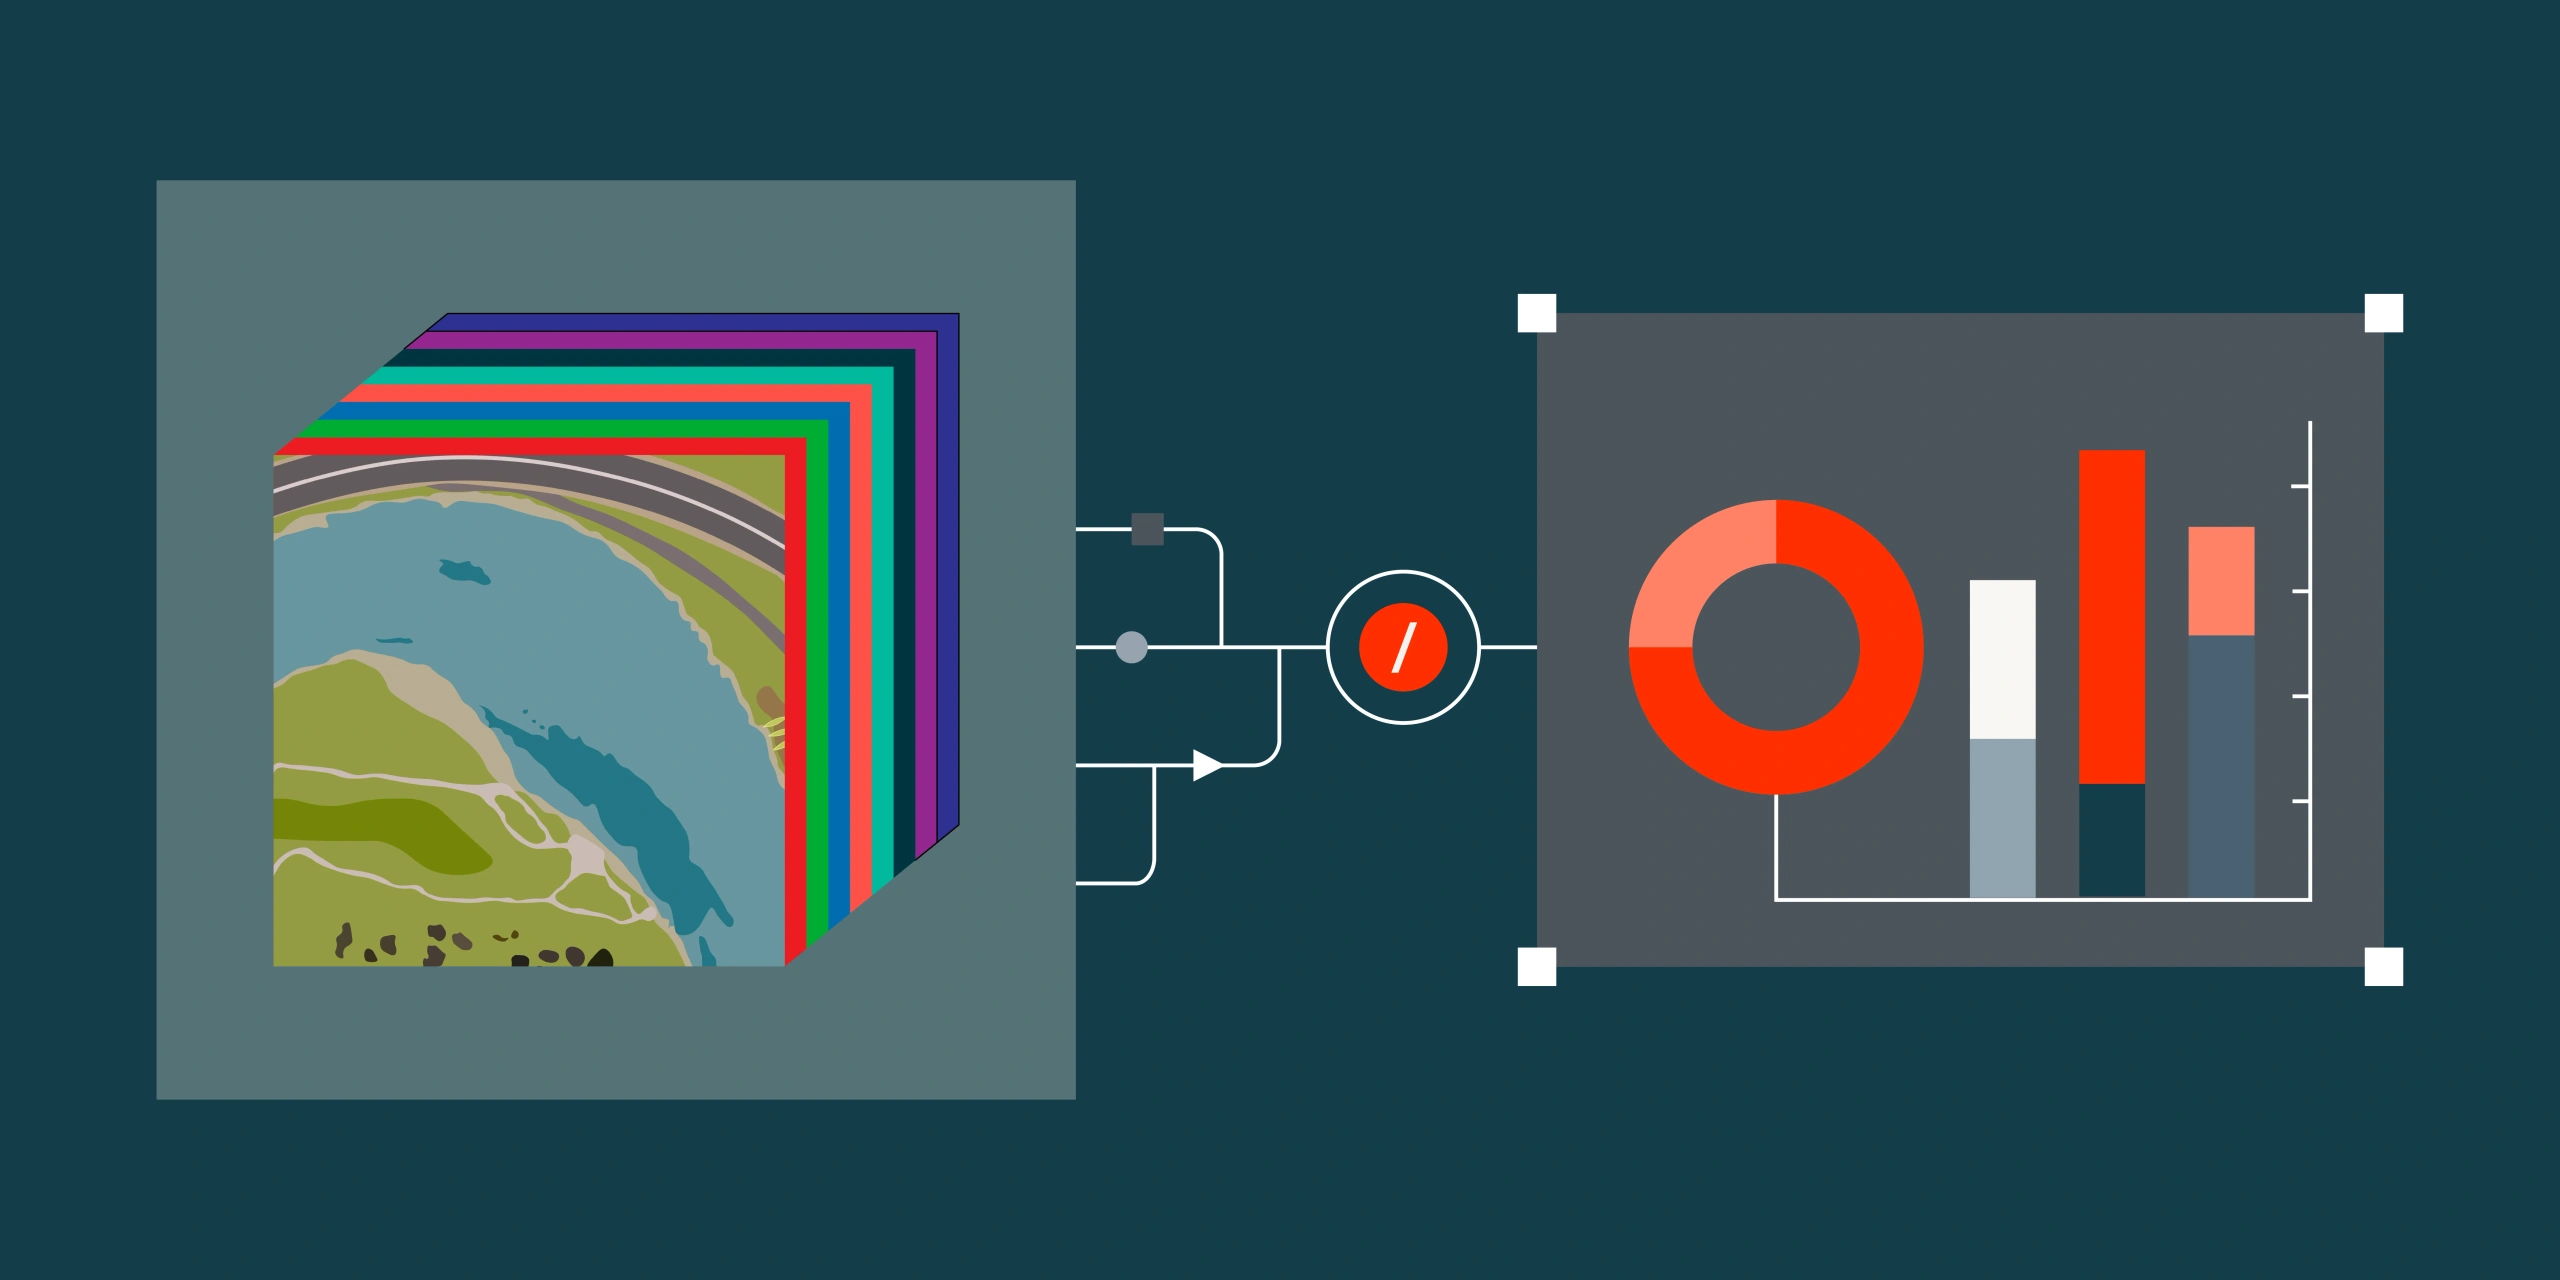
- Spectral insight: Multispectral sensors capture wavelengths beyond the visible spectrum, allowing vegetation health, soil moisture and water quality to be quantified rather than just observed visually.
Importantly, satellite data is rarely a replacement for fieldwork. It works best as a complement that guides where and when field visits are needed, focusing limited ground resources on the areas that matter most.
Monitoring Use Cases and Their Data
Different environmental applications require different types of satellite data. Below are the most common use cases and the sensor characteristics that serve them best.
Vegetation Health and Land Cover Monitoring
Tracking vegetation condition, biomass and land cover change is one of the most widespread uses of satellite imagery in environmental work.
- Resolution: 10m multispectral imagery (such as Sentinel-2) is widely used for regional vegetation mapping and time-series analysis. Higher-resolution optical data (50cm or 30cm) may be used where detailed species-level or structural information is required.
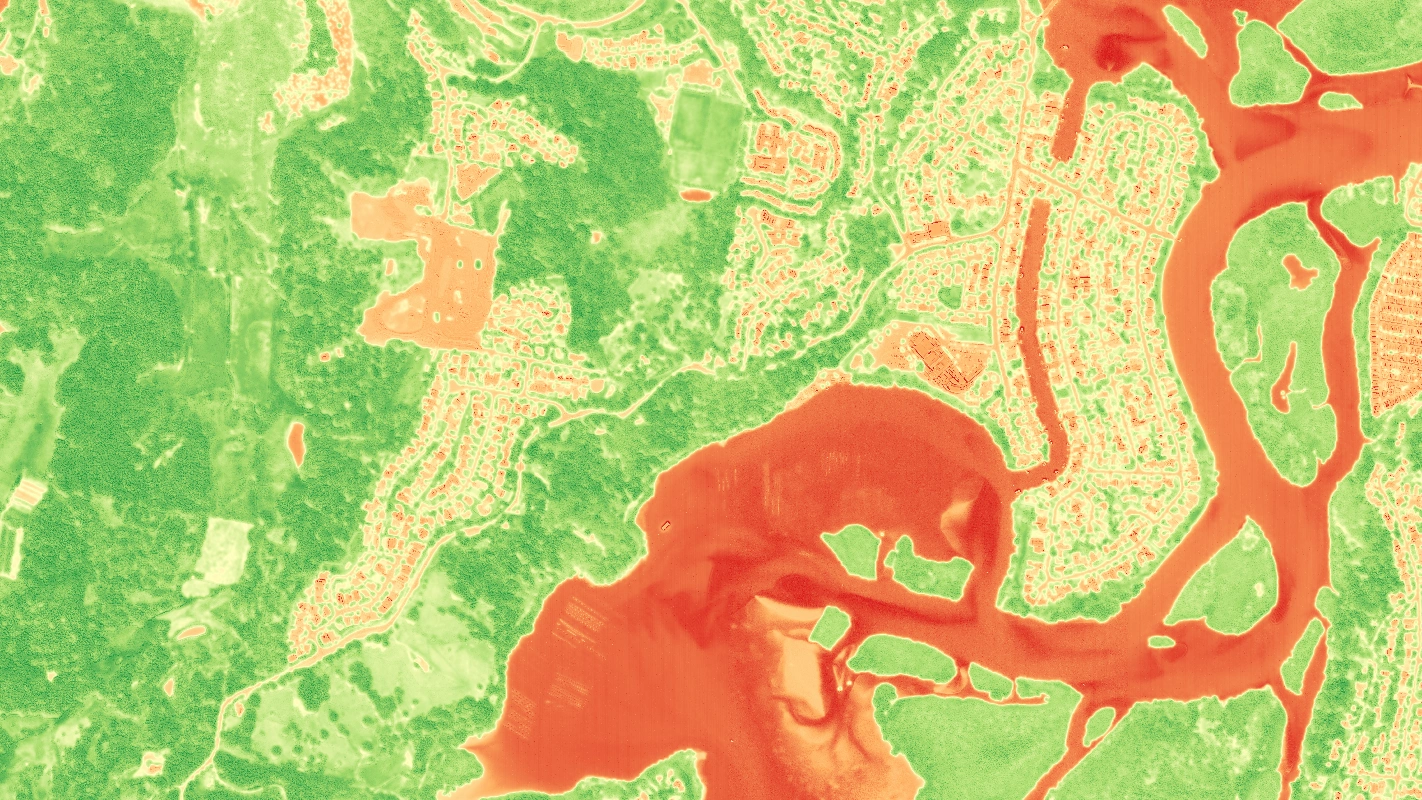
- Key indices: NDVI (Normalized Difference Vegetation Index) and its variants (EVI, NDWI) are commonly calculated from multispectral bands to quantify vegetation density, stress and water content (see our guide to band combinations and indices).
- Frequency: Monthly or seasonal monitoring is typical, although more frequent captures may be used during critical growth periods or after disturbance events.
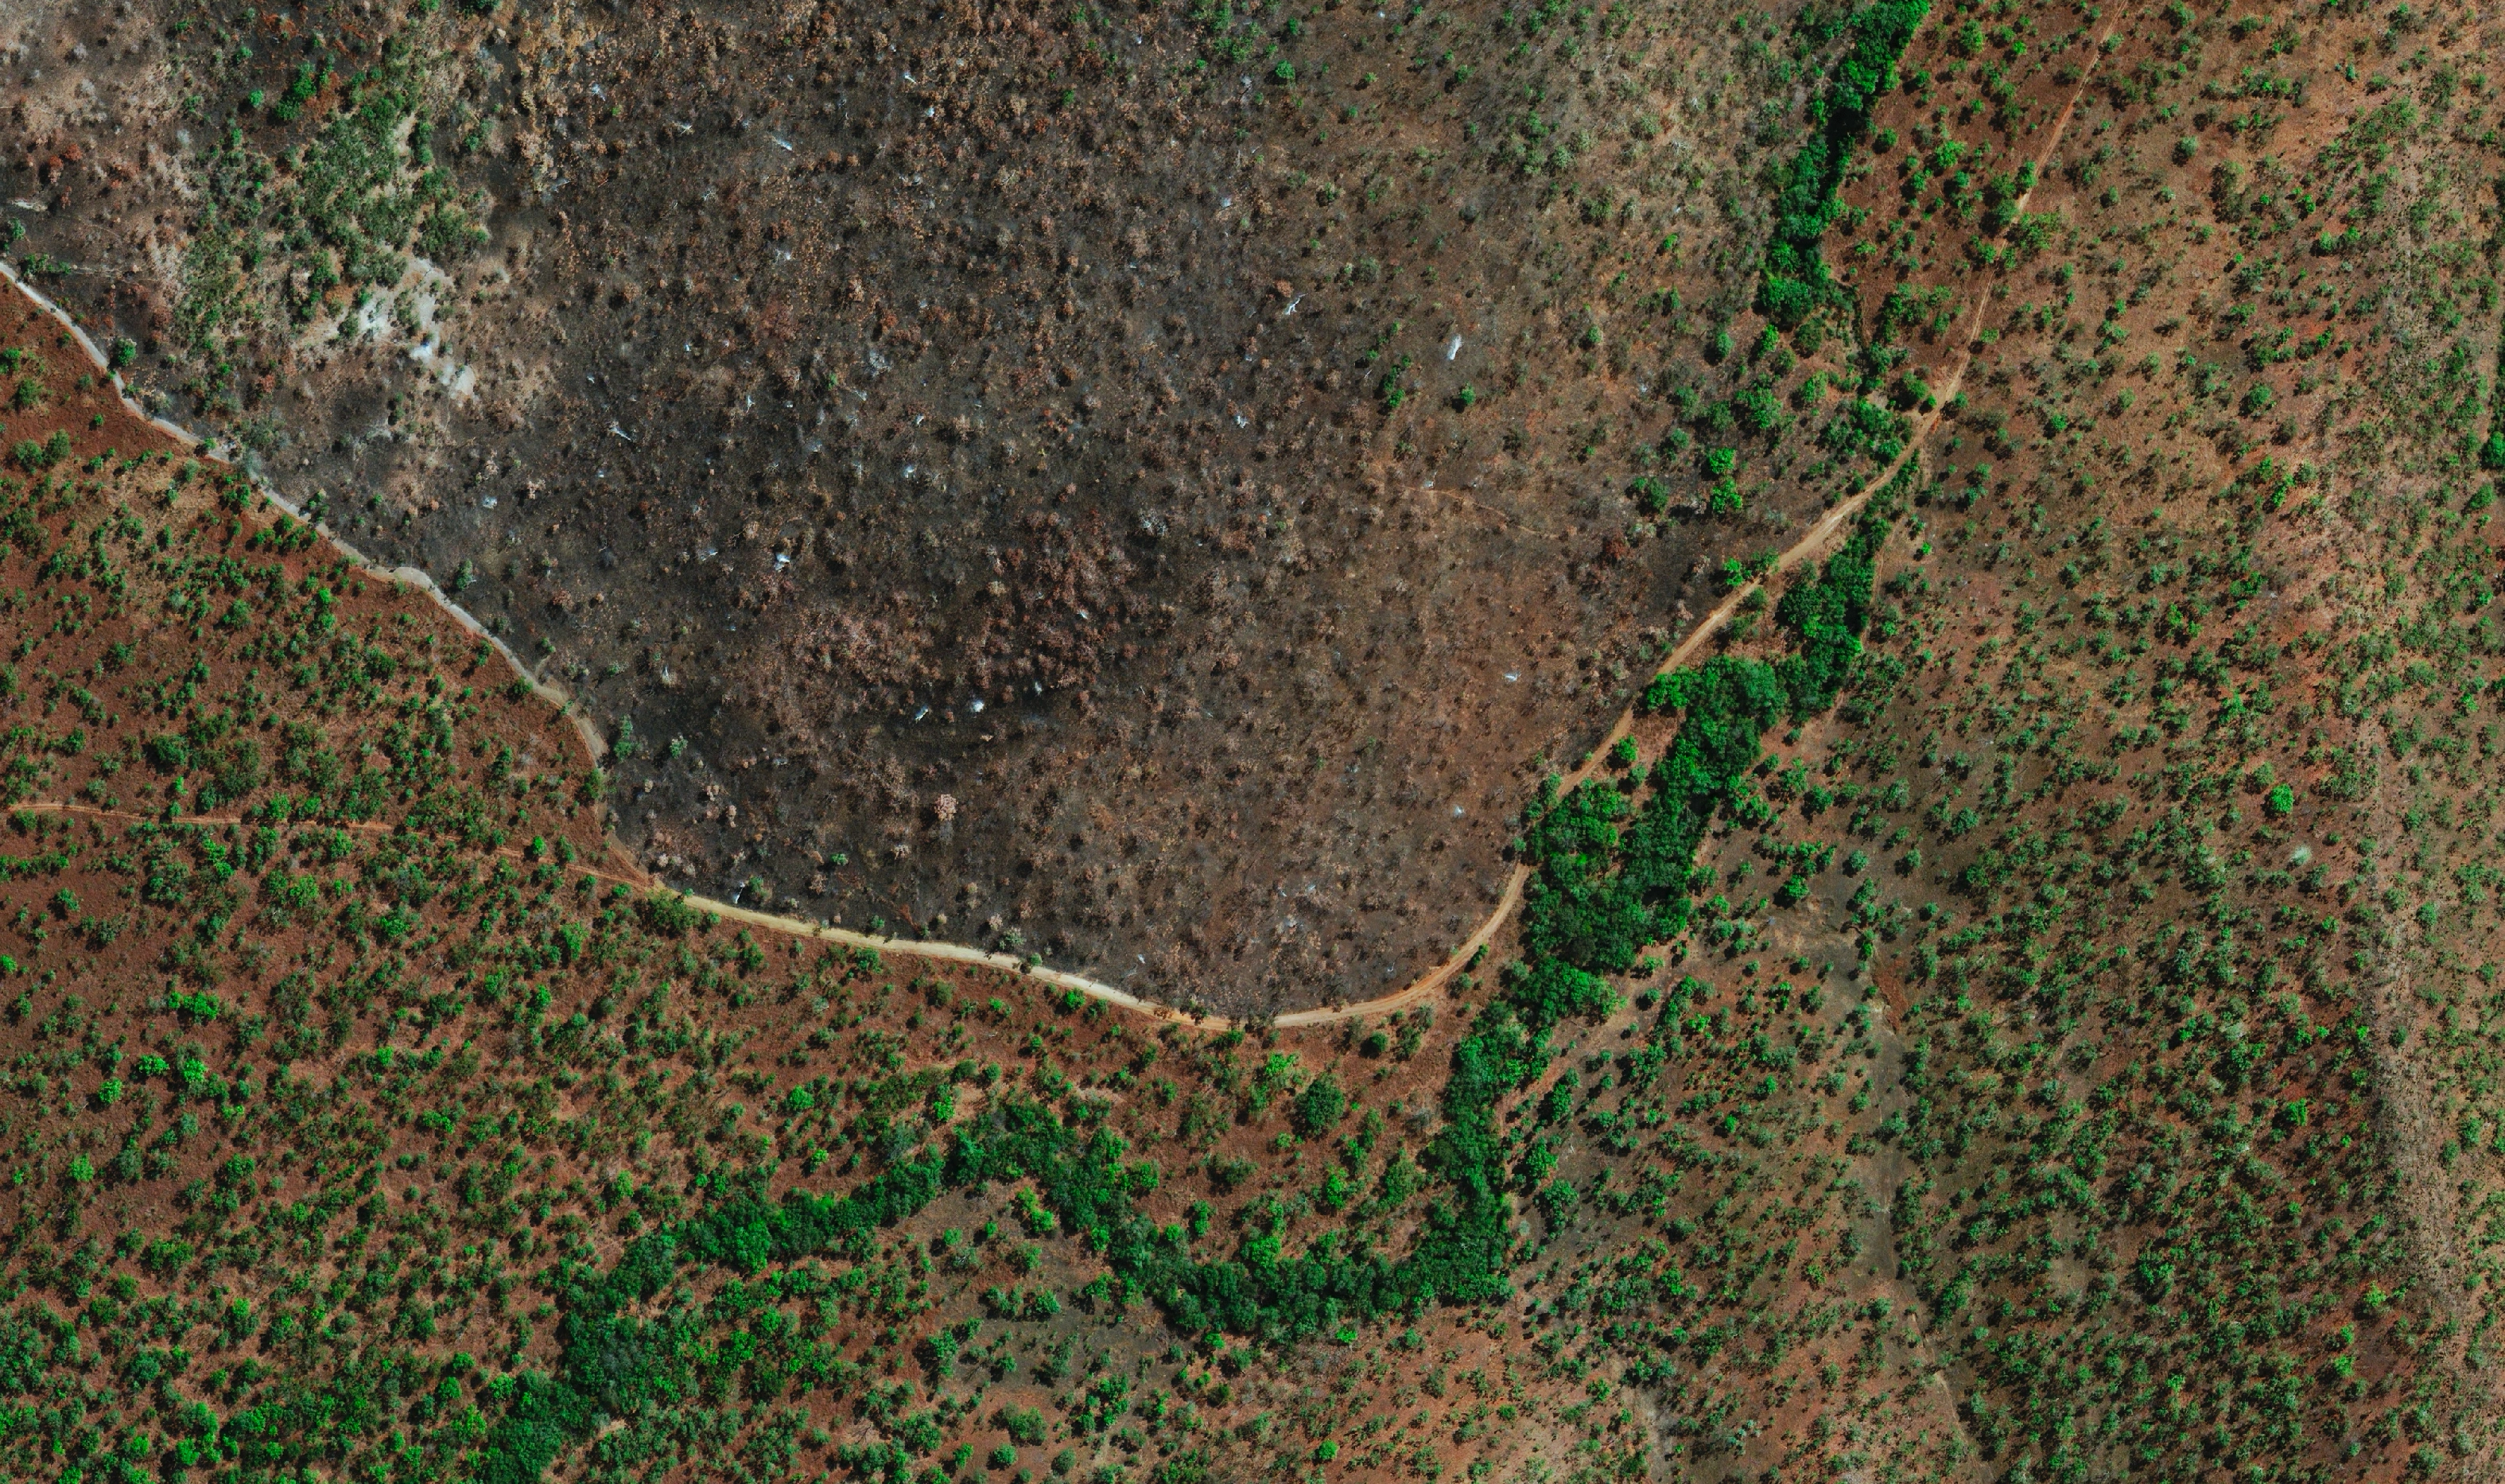
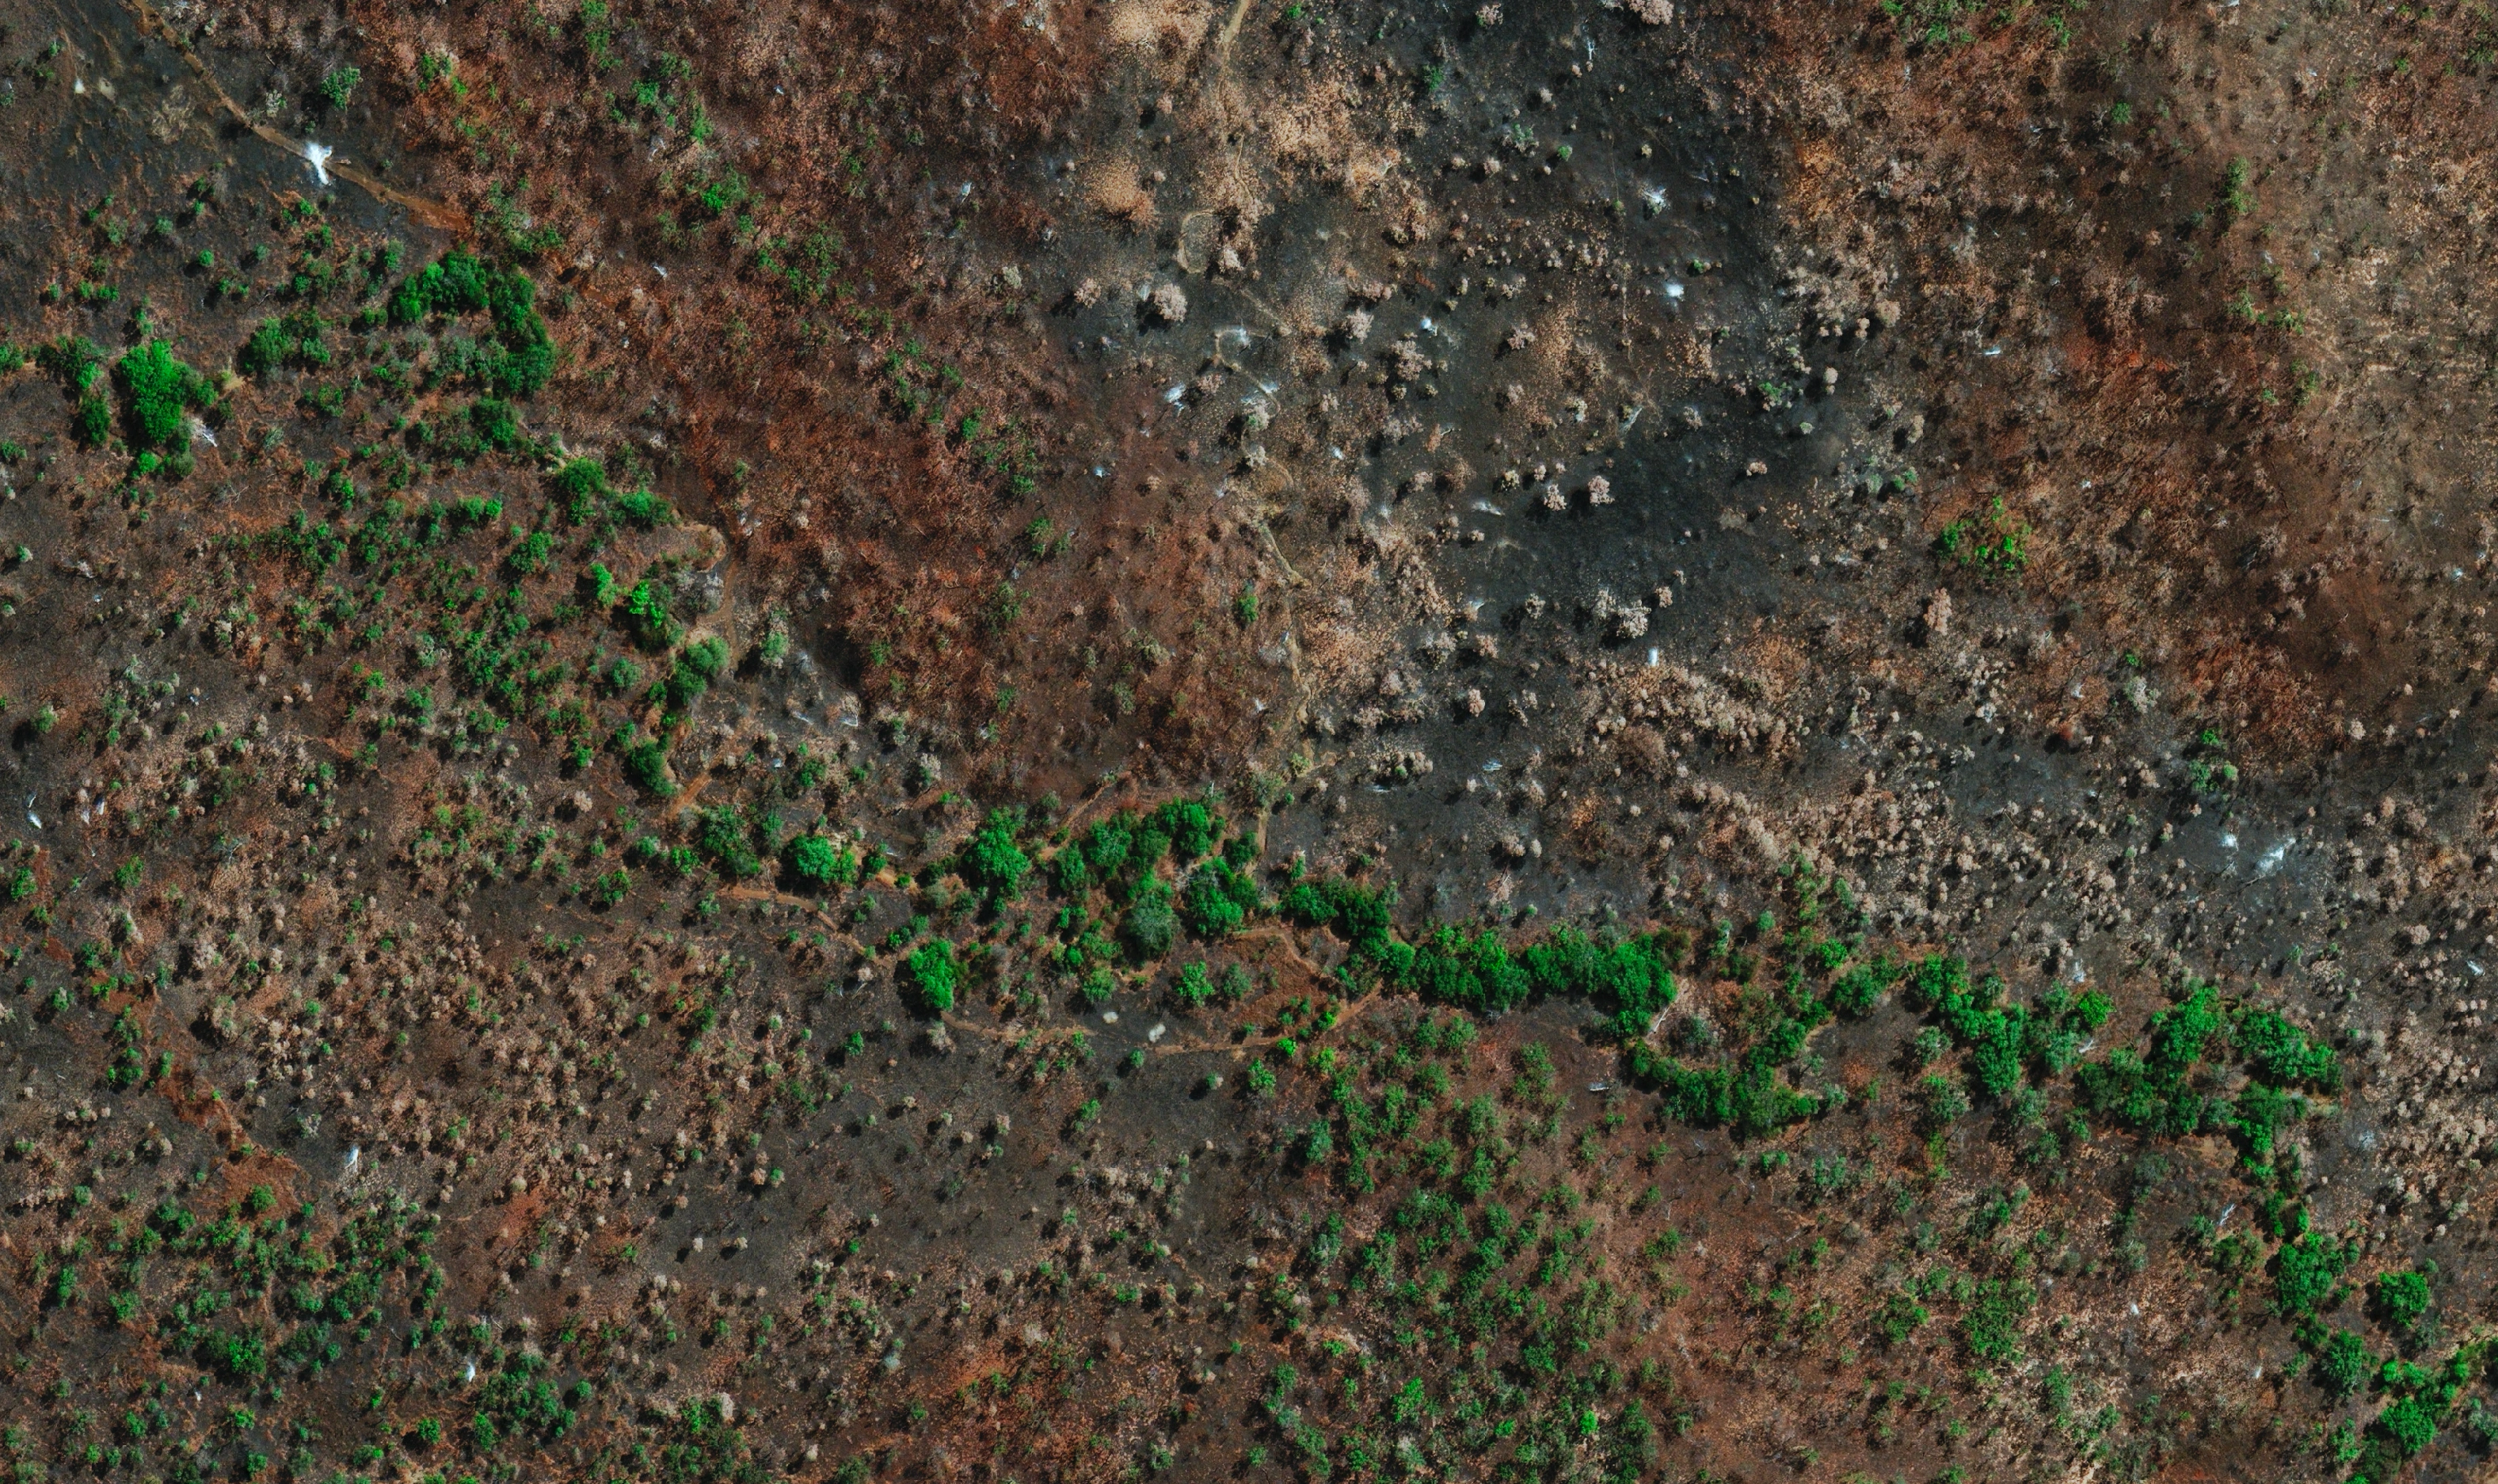
Disturbance events such as fire are a major driver of land cover change, and satellite imagery is widely used to map their extent, gauge severity and track recovery over time. After a bushfire, medium-resolution data like Sentinel-2 is well suited to mapping the overall burn extent across a region, while high-resolution optical imagery resolves the detail within it: which stands of vegetation were destroyed, which survived, and where early regrowth is taking hold.
Specialised indices add another layer. The Normalized Burn Ratio (NBR), calculated from near-infrared and shortwave-infrared bands, separates burnt ground from healthy vegetation, and comparing NBR before and after an event produces a consistent map of severity rather than a purely visual assessment. Repeating these observations across seasons turns a single snapshot of damage into a record of how an ecosystem recovers, which is exactly the kind of long-term, repeatable measurement satellites are built for.
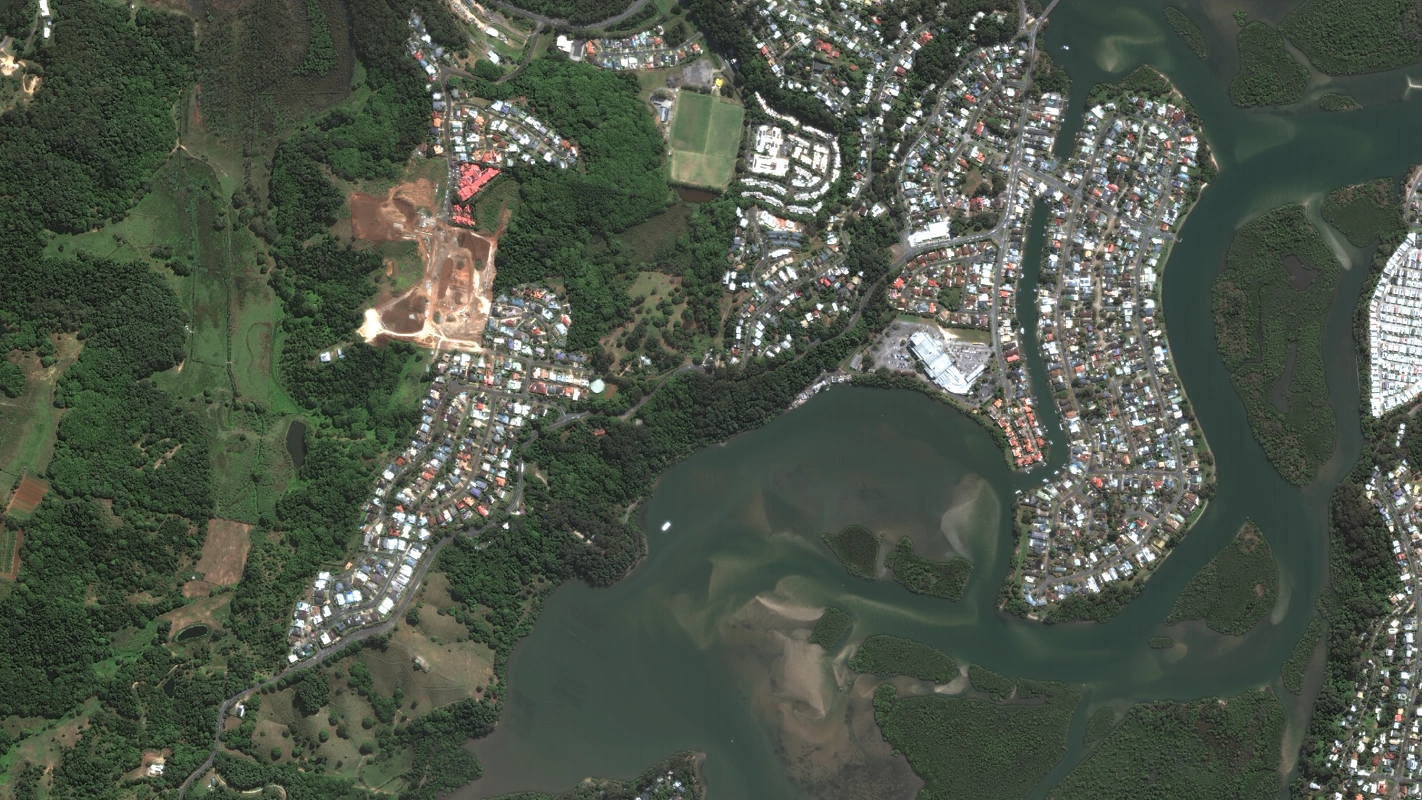
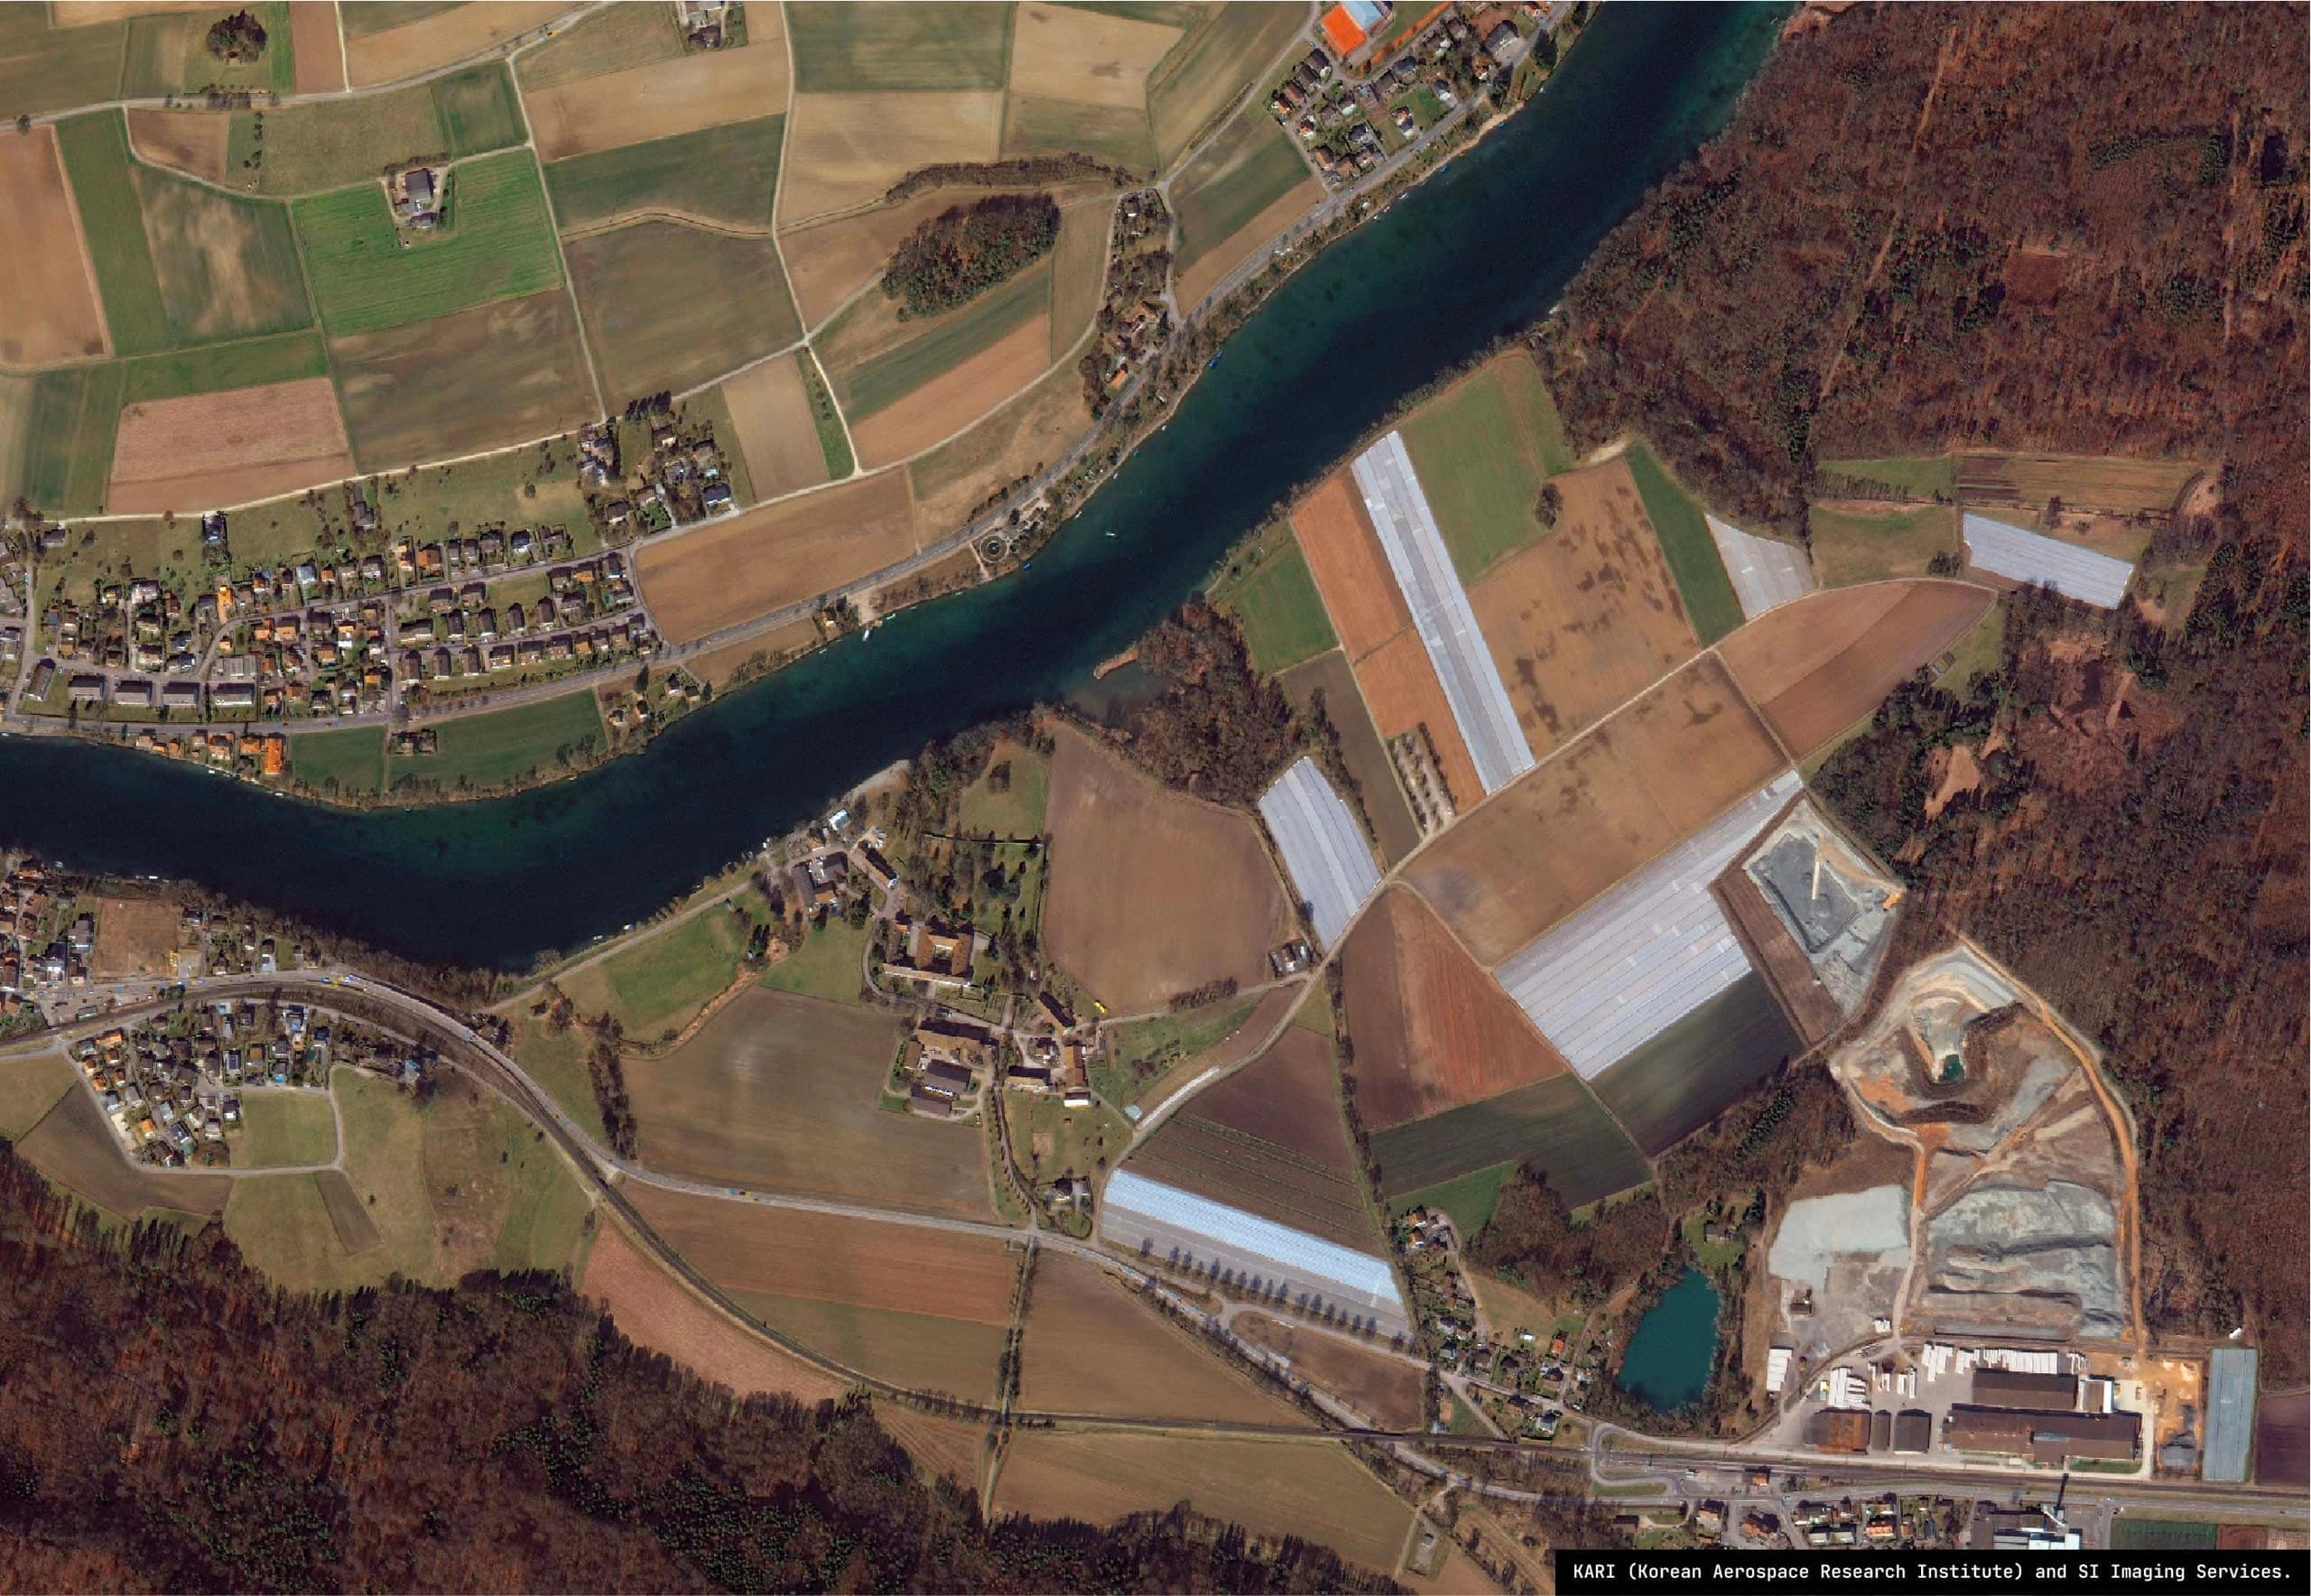
Water Quality and Water Body Monitoring
Monitoring lakes, rivers, wetlands and coastal systems benefits from multispectral and hyperspectral imagery.
- Multispectral sensors can detect turbidity, chlorophyll concentration and suspended sediment using combinations of visible and near-infrared bands.
- Resolution and revisit: Medium-resolution data (10m) is often sufficient for broad water body monitoring, while commercial tasking may be used for targeted hotspot assessment.
Deforestation and Land Clearing Detection
Illegal or unplanned land clearing remains a major environmental concern. Satellite imagery is one of the most effective tools for early detection and verification.
- Change detection workflows compare archive or newly tasked imagery against known baselines to identify new disturbance.
- Resolution choice: Medium-resolution data (10m) is effective for tracking large-scale clearing trends, while high-resolution optical imagery (50cm or 30cm) is used to verify events more accurately and assess impact severity.
- Temporal strategy: Frequent revisits reduce the risk of missing rapid clearing events, particularly in regions with high cloud cover where SAR (Synthetic Aperture Radar) may supplement optical data.
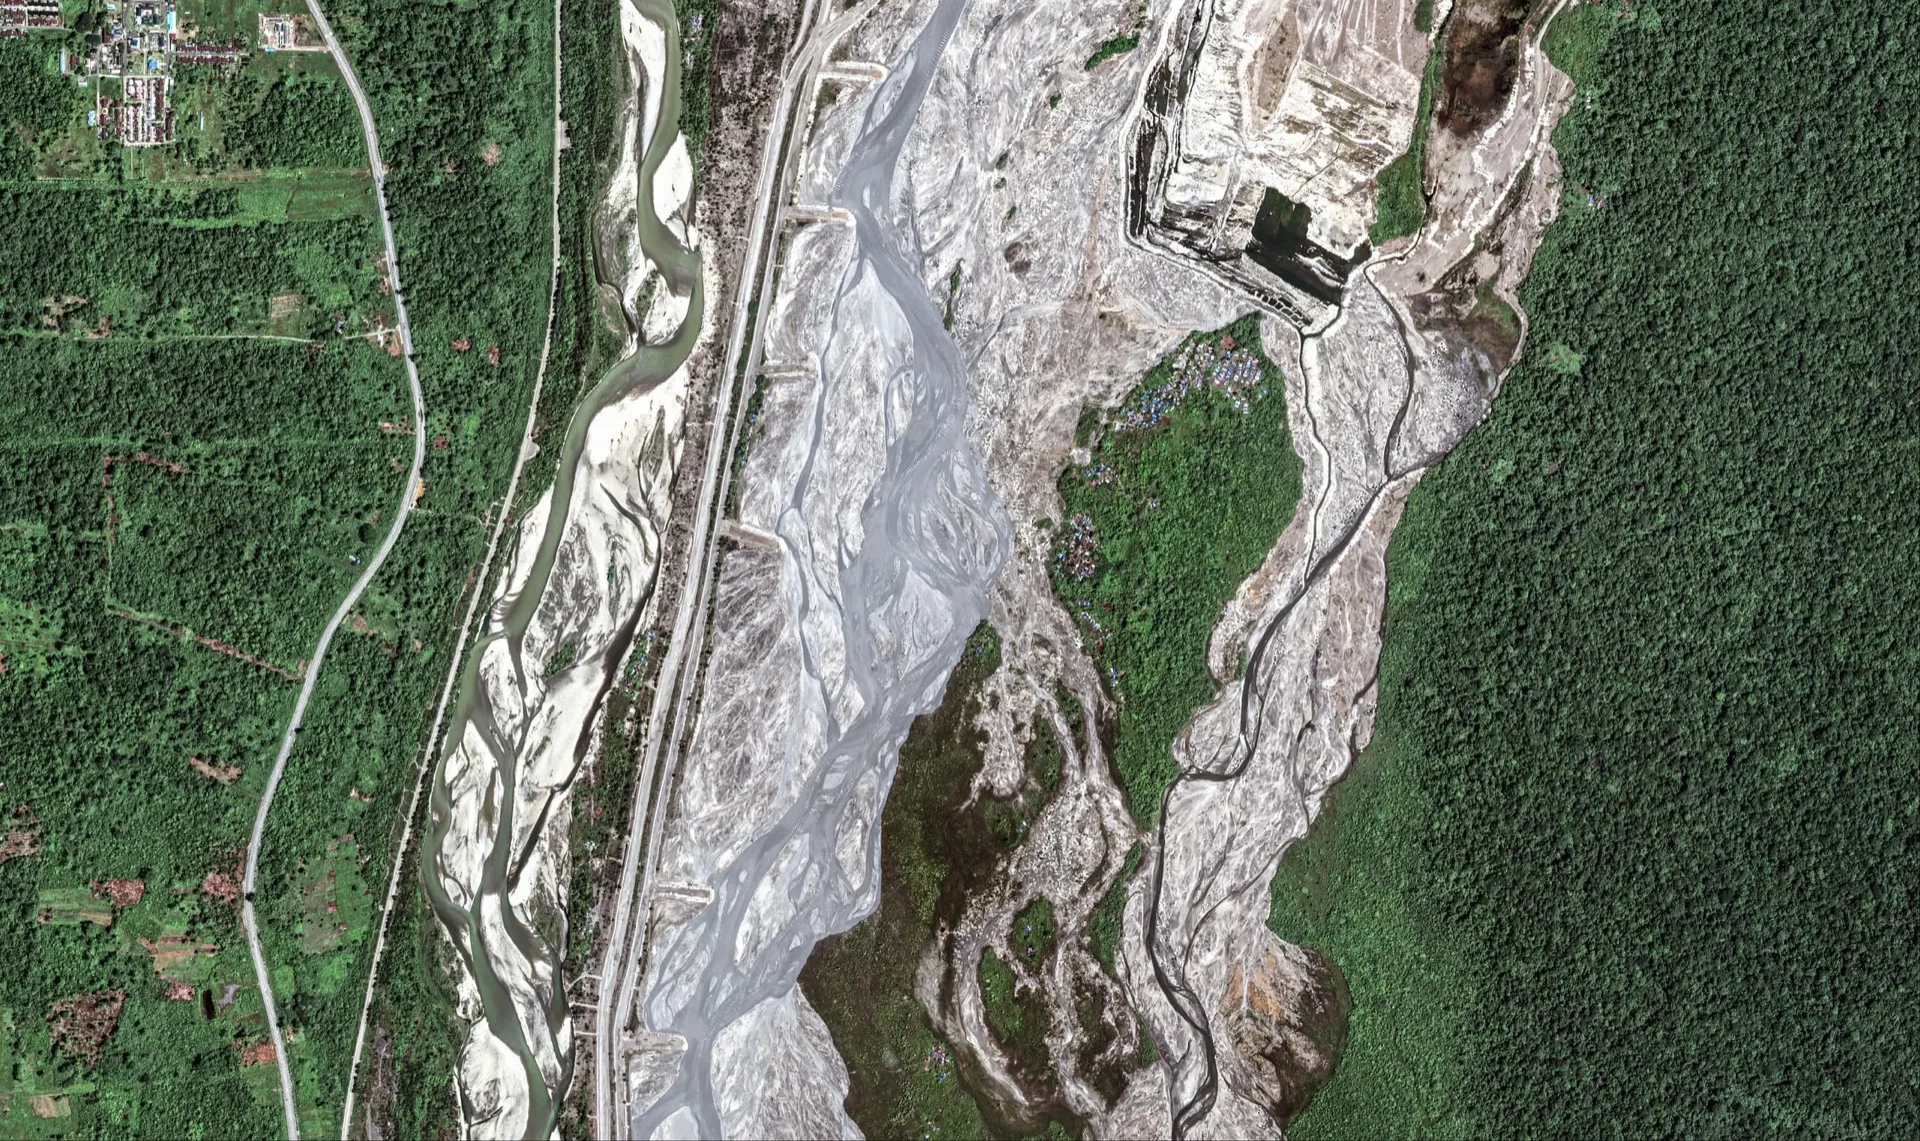
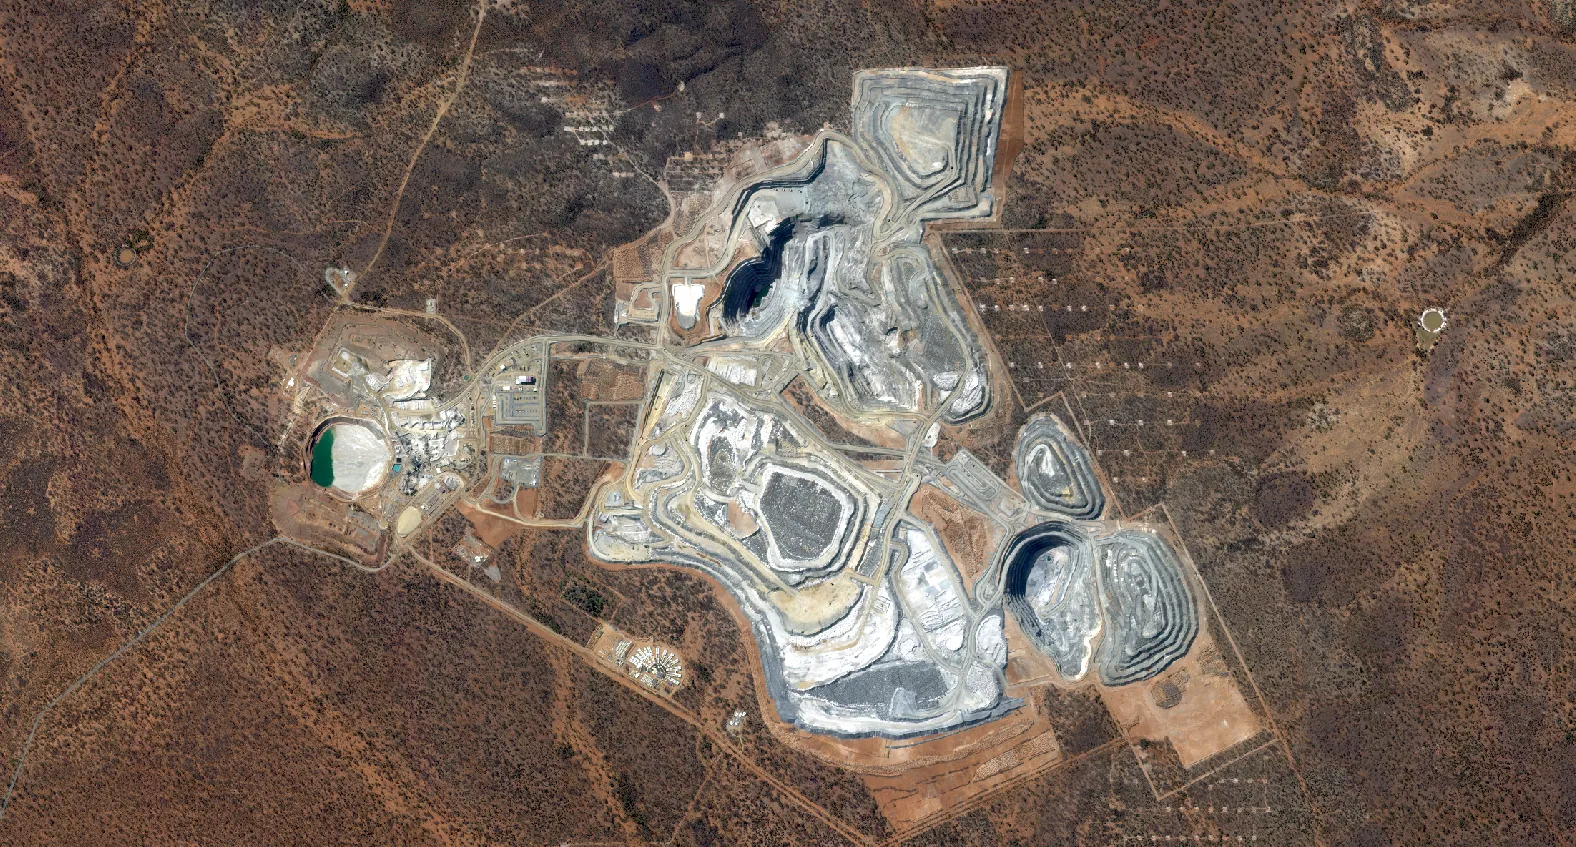
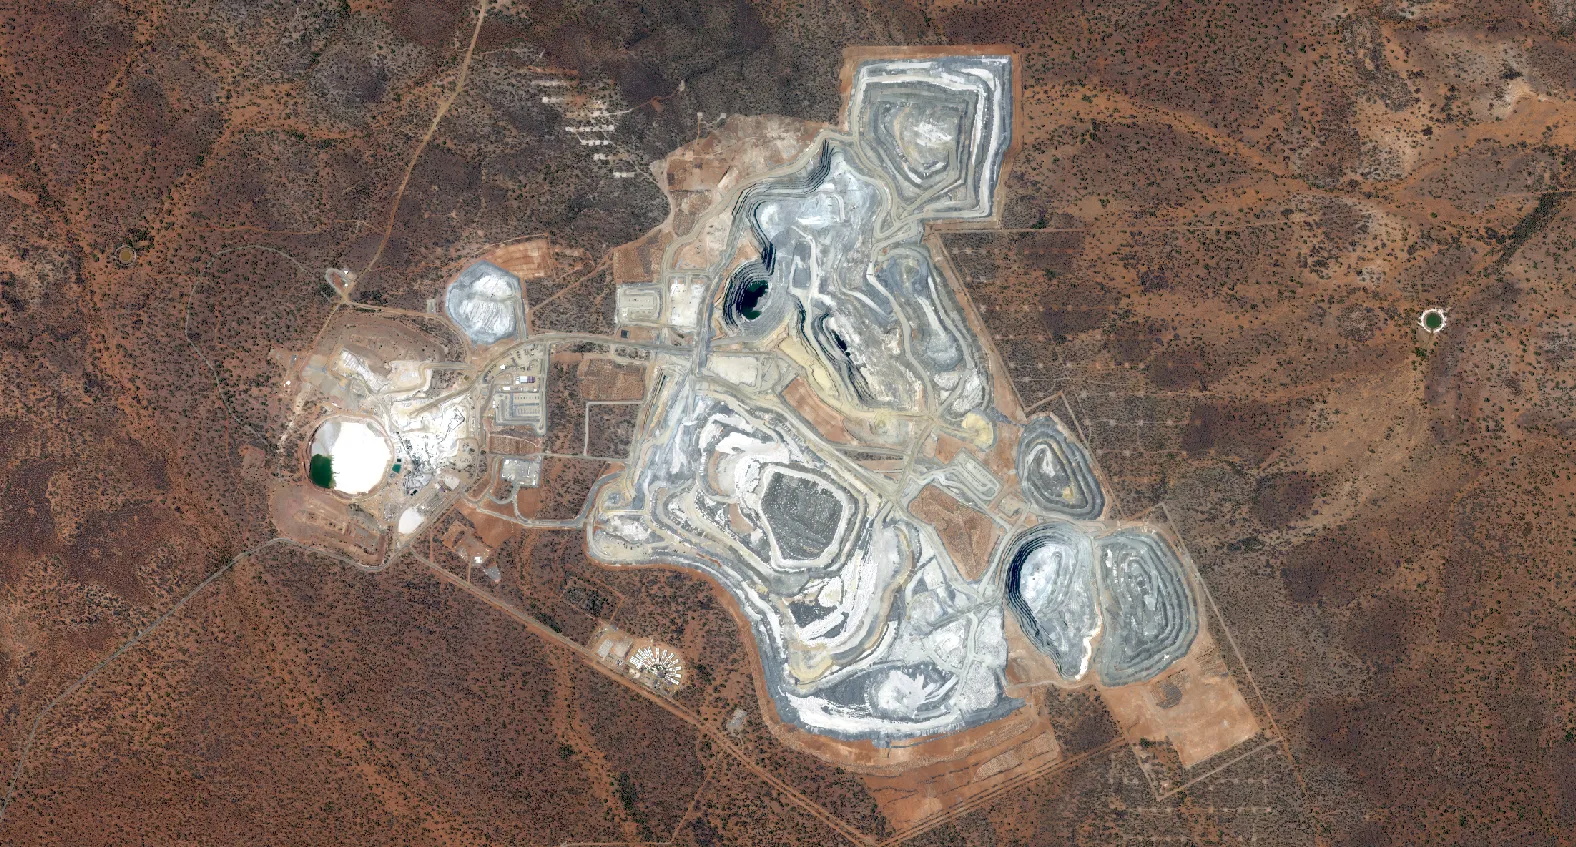
Rehabilitation and Mine Site Compliance
Mining and resource companies are increasingly required to monitor rehabilitation progress, disturbance tracking and environmental compliance.
- High-resolution optical imagery (30cm to 50cm) is used to track vegetation regrowth, soil erosion and structural changes across rehabilitated areas.
- Change detection over time provides quantifiable evidence of rehabilitation progress for regulatory reporting.
- Orthorectified data ensures that measurements of disturbed area or vegetation cover are spatially accurate and comparable year to year.
Choosing the Right Resolution
One of the most common questions we receive is: What resolution do I need for my environmental project?
The answer depends on the scale of the study and the level of detail required.
| Resolution | Typical Use Case |
|---|---|
| 10m | Regional vegetation monitoring, water body mapping, broad environmental baselines |
| 50cm | Catchment-scale monitoring, infrastructure corridor assessment, detailed land use change |
| 30cm | Fine-scale rehabilitation monitoring, hotspot verification, species habitat assessment |
Higher resolution is not always better. For large-area environmental monitoring, 10m multispectral data often provides the best balance of coverage, cost and analytical capability. High-resolution imagery is most valuable when detailed verification or small-area focus is required. For a deeper look at matching detail to budget, see our complete guide to buying satellite imagery.
Archive vs Tasking: History and Recency
Environmental programs typically benefit from a combination of archive and tasked imagery. The two serve different purposes, and the table below summarises where each one fits.
| Aspect | Archive Imagery | Tasked Imagery |
|---|---|---|
| What it offers | Historical data for trend analysis and baseline establishment | The most recent conditions, critical for detecting new disturbances, seasonal impacts or emergency responses |
| Cost & availability | Cost-effective and quickly available | Higher cost; delivery depends on revisit rate and weather |
| Control | Limited to scenes that already exist | Control over acquisition timing and cloud-cover tolerance |
| Best for | Long-term vegetation cycles, urban expansion and cumulative environmental change | Compliance monitoring, rehabilitation tracking and time-sensitive assessments |
In practice, most environmental programs combine historical archive data with regular tasking. This hybrid approach delivers both long-term context and current insight, and the right balance usually comes down to how time-sensitive the question is. Our guide on archive vs tasking covers the trade-offs in more detail.
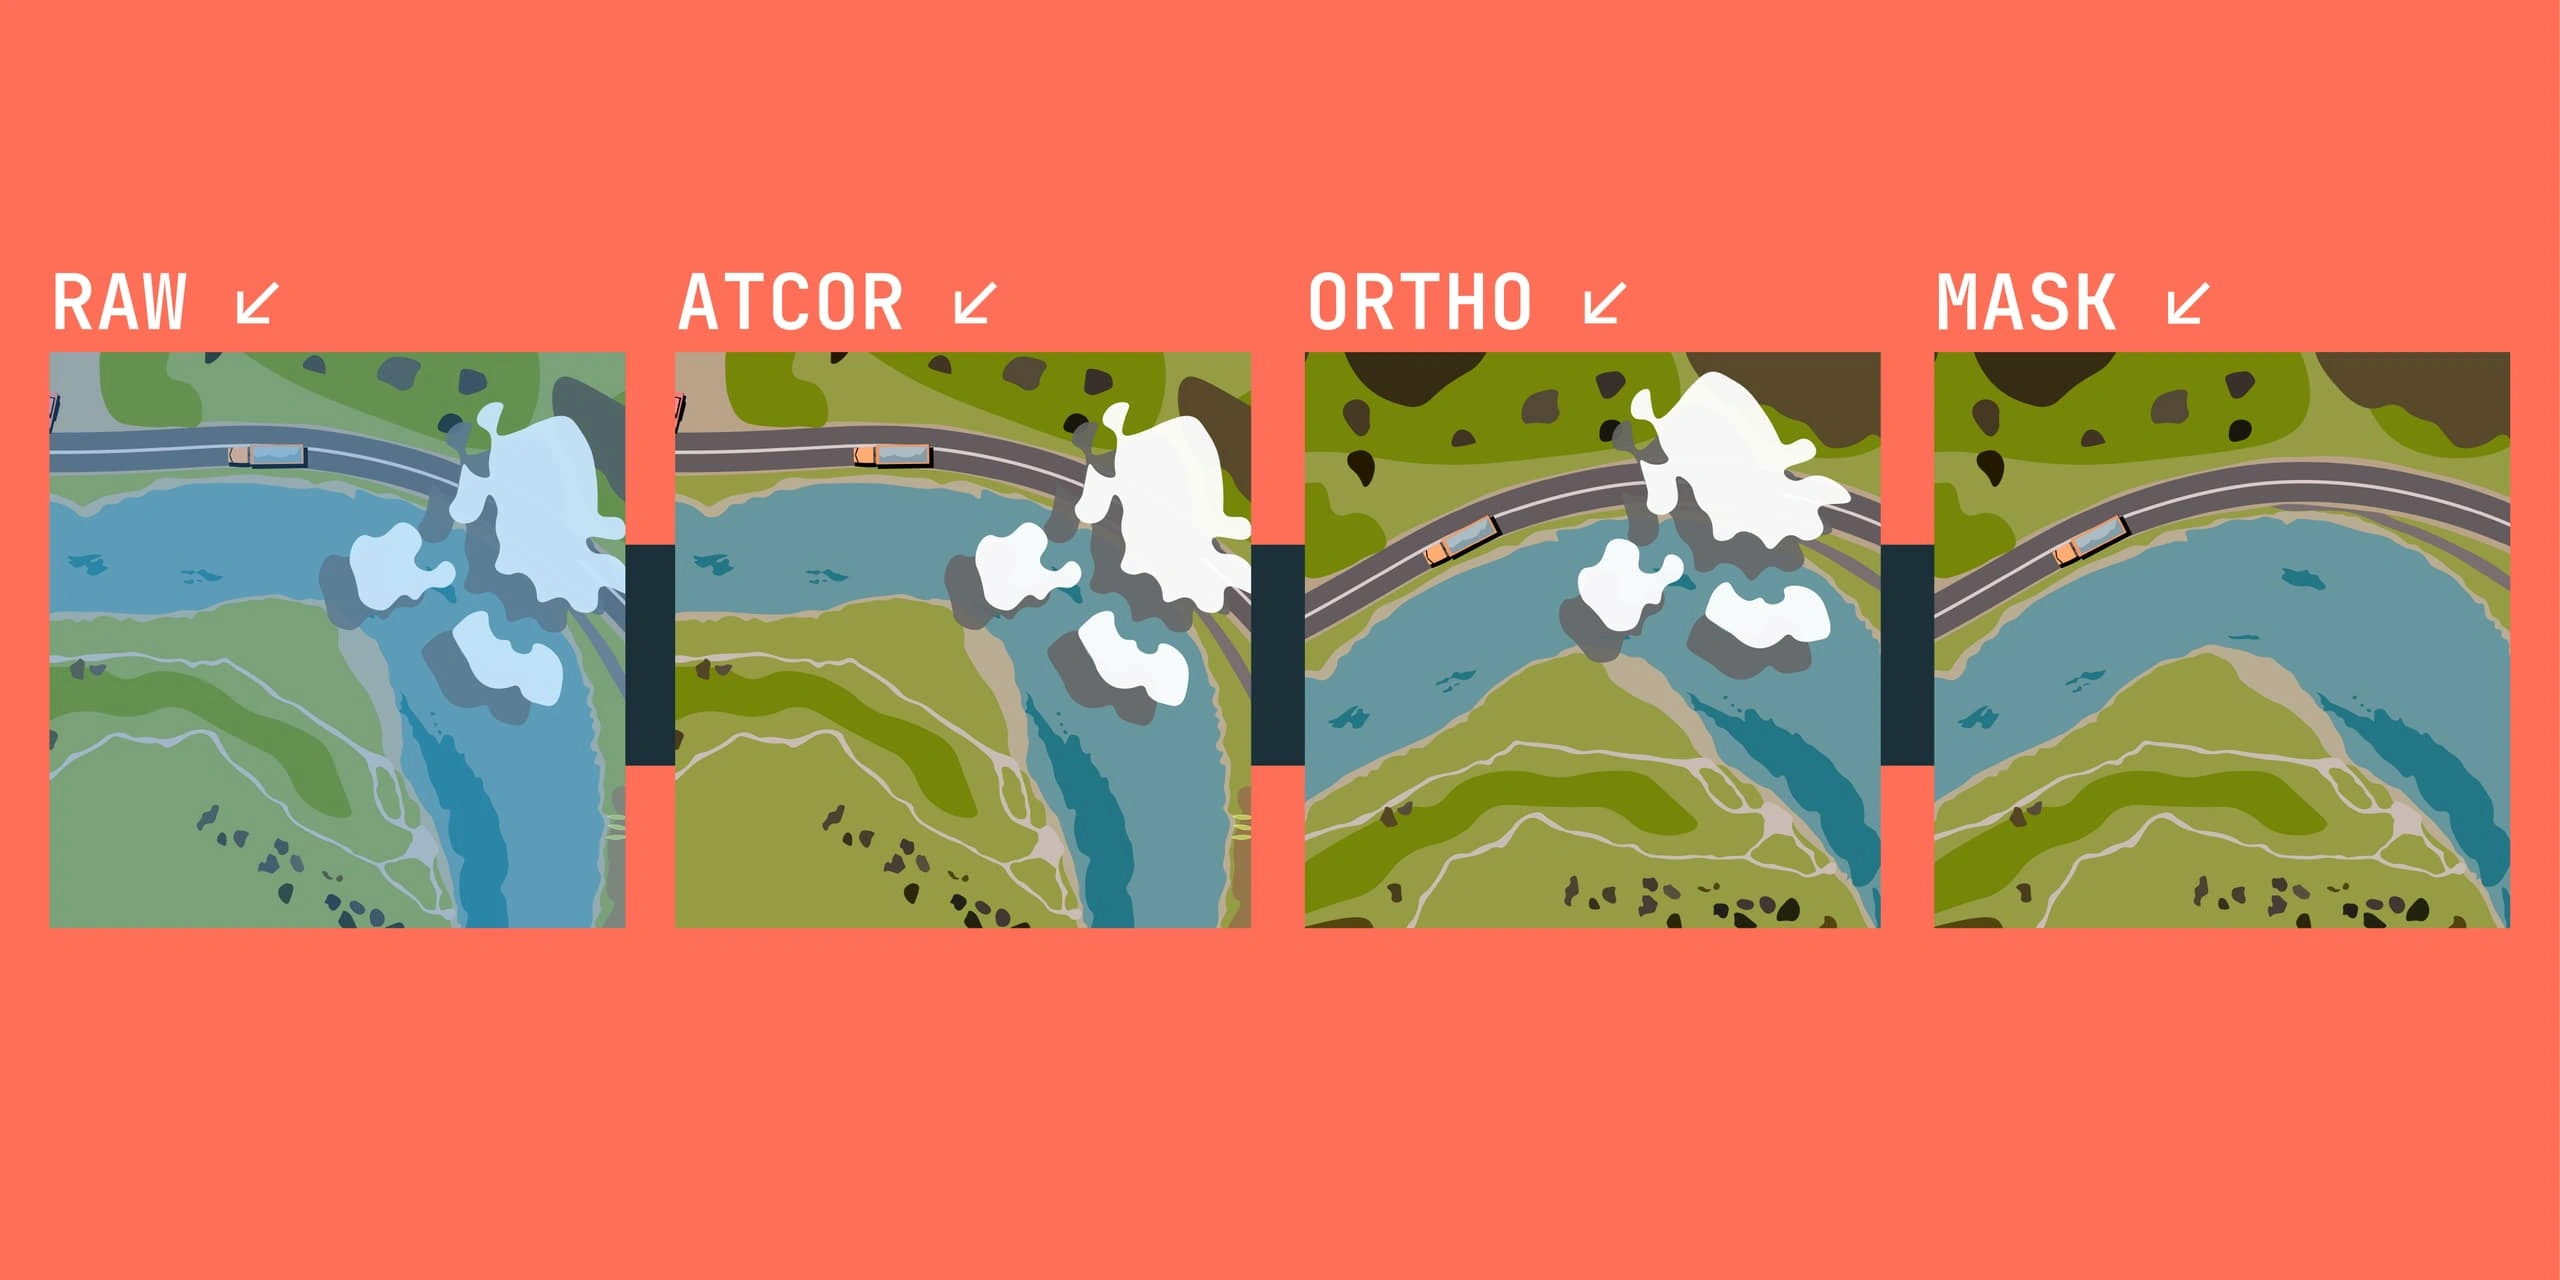
Where several scenes are needed to cover a large area, Terrabit processes them in house into a seamless mosaic, delivering orthorectified, analysis-ready imagery as one cohesive dataset rather than a collection of individual scenes to align and stitch together separately.
Overcoming Cloud Cover
Cloud cover remains one of the biggest challenges for optical satellite monitoring, particularly in tropical and coastal regions.
Practical strategies include:
- High-revisit constellations: Satellites with short revisit rates increase the likelihood of capturing cloud-free scenes.
- SAR (Synthetic Aperture Radar) integration: SAR imagery penetrates cloud, smoke and haze, providing consistent observation regardless of weather. It is particularly useful for monitoring flood extent, wetland dynamics and vegetation structure.
- Flexible acquisition windows: Setting broader tasking windows allows satellites multiple opportunities to capture clear imagery.
- Blended approaches: Combining optical and SAR data provides the best of both worlds: spectral richness from optical and all-weather reliability from radar.
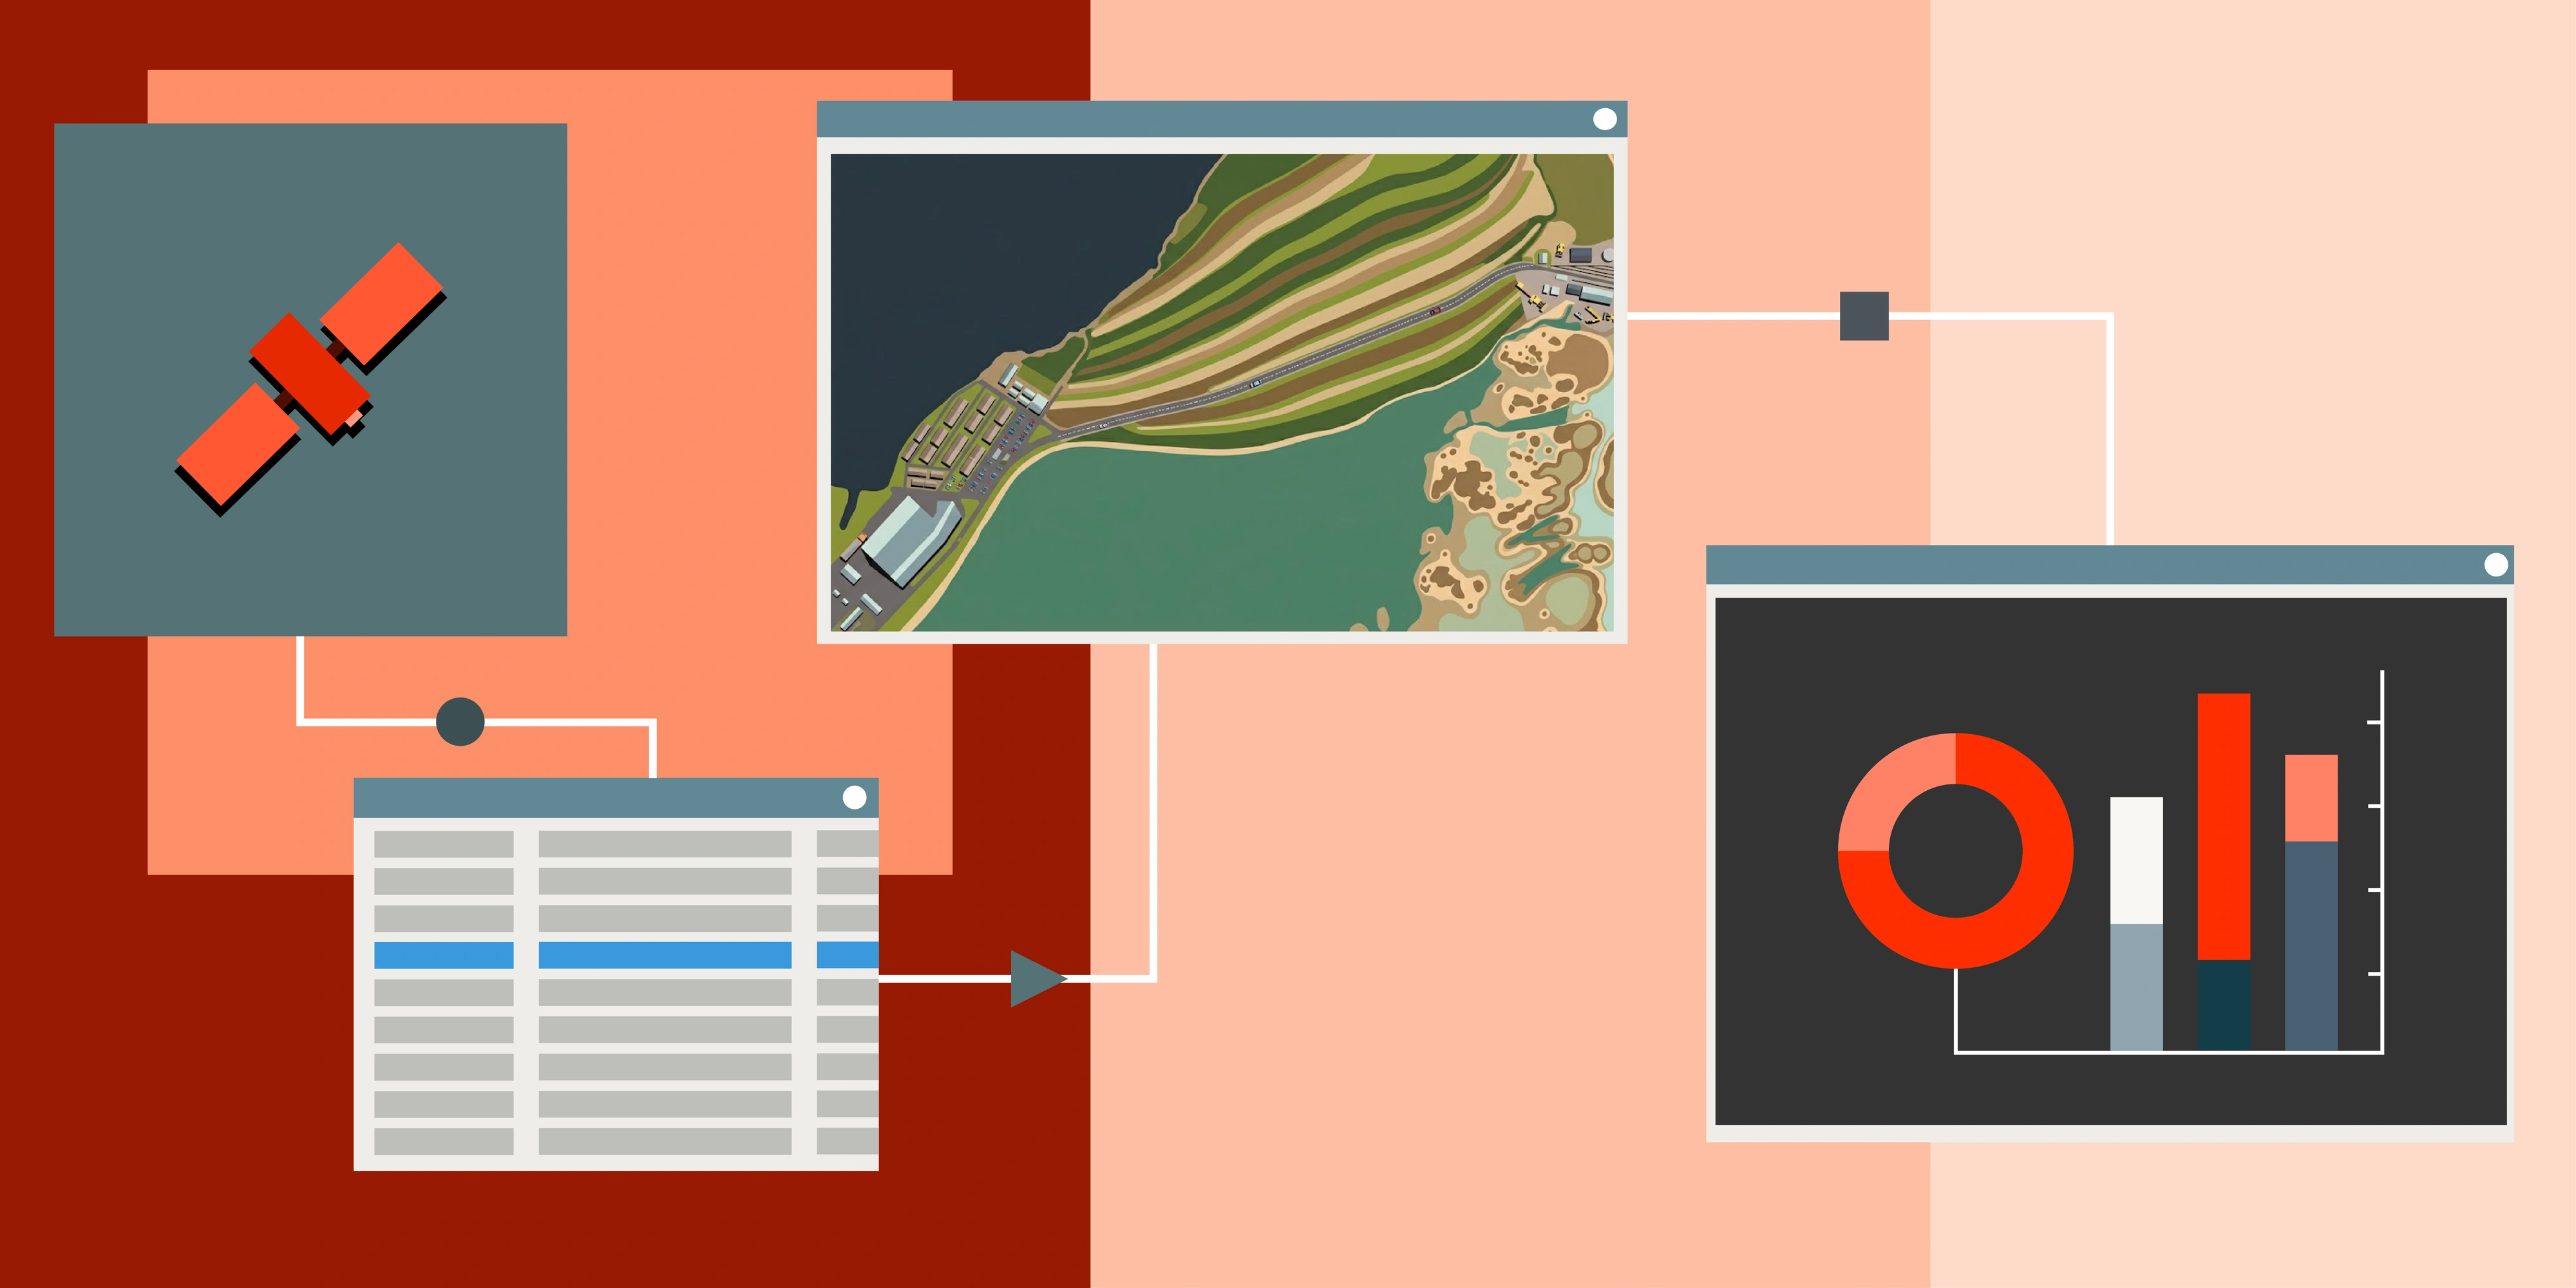
From Pixels to Decisions: Change Detection
Change detection is the analytical engine behind most environmental monitoring programs. By comparing satellite images captured at different times, analysts can identify and quantify changes in vegetation, water bodies, land disturbance and land cover.
Common change detection approaches include:
- Pixel-based analysis: Direct comparison of reflectance values between dates to detect surface change.
- Index-based analysis: Tracking changes in vegetation (NDVI) or water (NDWI) indices over time to quantify environmental health.
- Time-series analysis: Using multiple observations to identify gradual trends rather than single events.
- Post-classification comparison: Classifying each image before comparing land cover categories to assess urban expansion, deforestation or habitat loss.
Accurate change detection requires carefully preprocessed imagery, consistent sensor types and proper temporal spacing. Working from orthorectified, analysis-ready data reduces preprocessing overhead and improves the reliability of change detection outputs.
Putting It All Together
A successful satellite-based environmental monitoring program typically follows these steps:
- Define objectives: What environmental indicators need to be tracked? What is the scale and frequency required?
- Select sensors and resolution: Choose the appropriate balance of spatial, spectral and temporal resolution for each application.
- Establish baselines: Use archive imagery to create historical reference points.
- Design acquisition strategy: Combine archive data with regular tasking to ensure consistent coverage.
- Plan for cloud and seasonal variability: Incorporate SAR or high-revisit optical options to mitigate cloud risk.
- Integrate change detection workflows: Build analytical pipelines that convert imagery into quantified environmental metrics.
- Validate and report: Combine satellite insights with ground truthing where necessary to produce robust environmental reports.
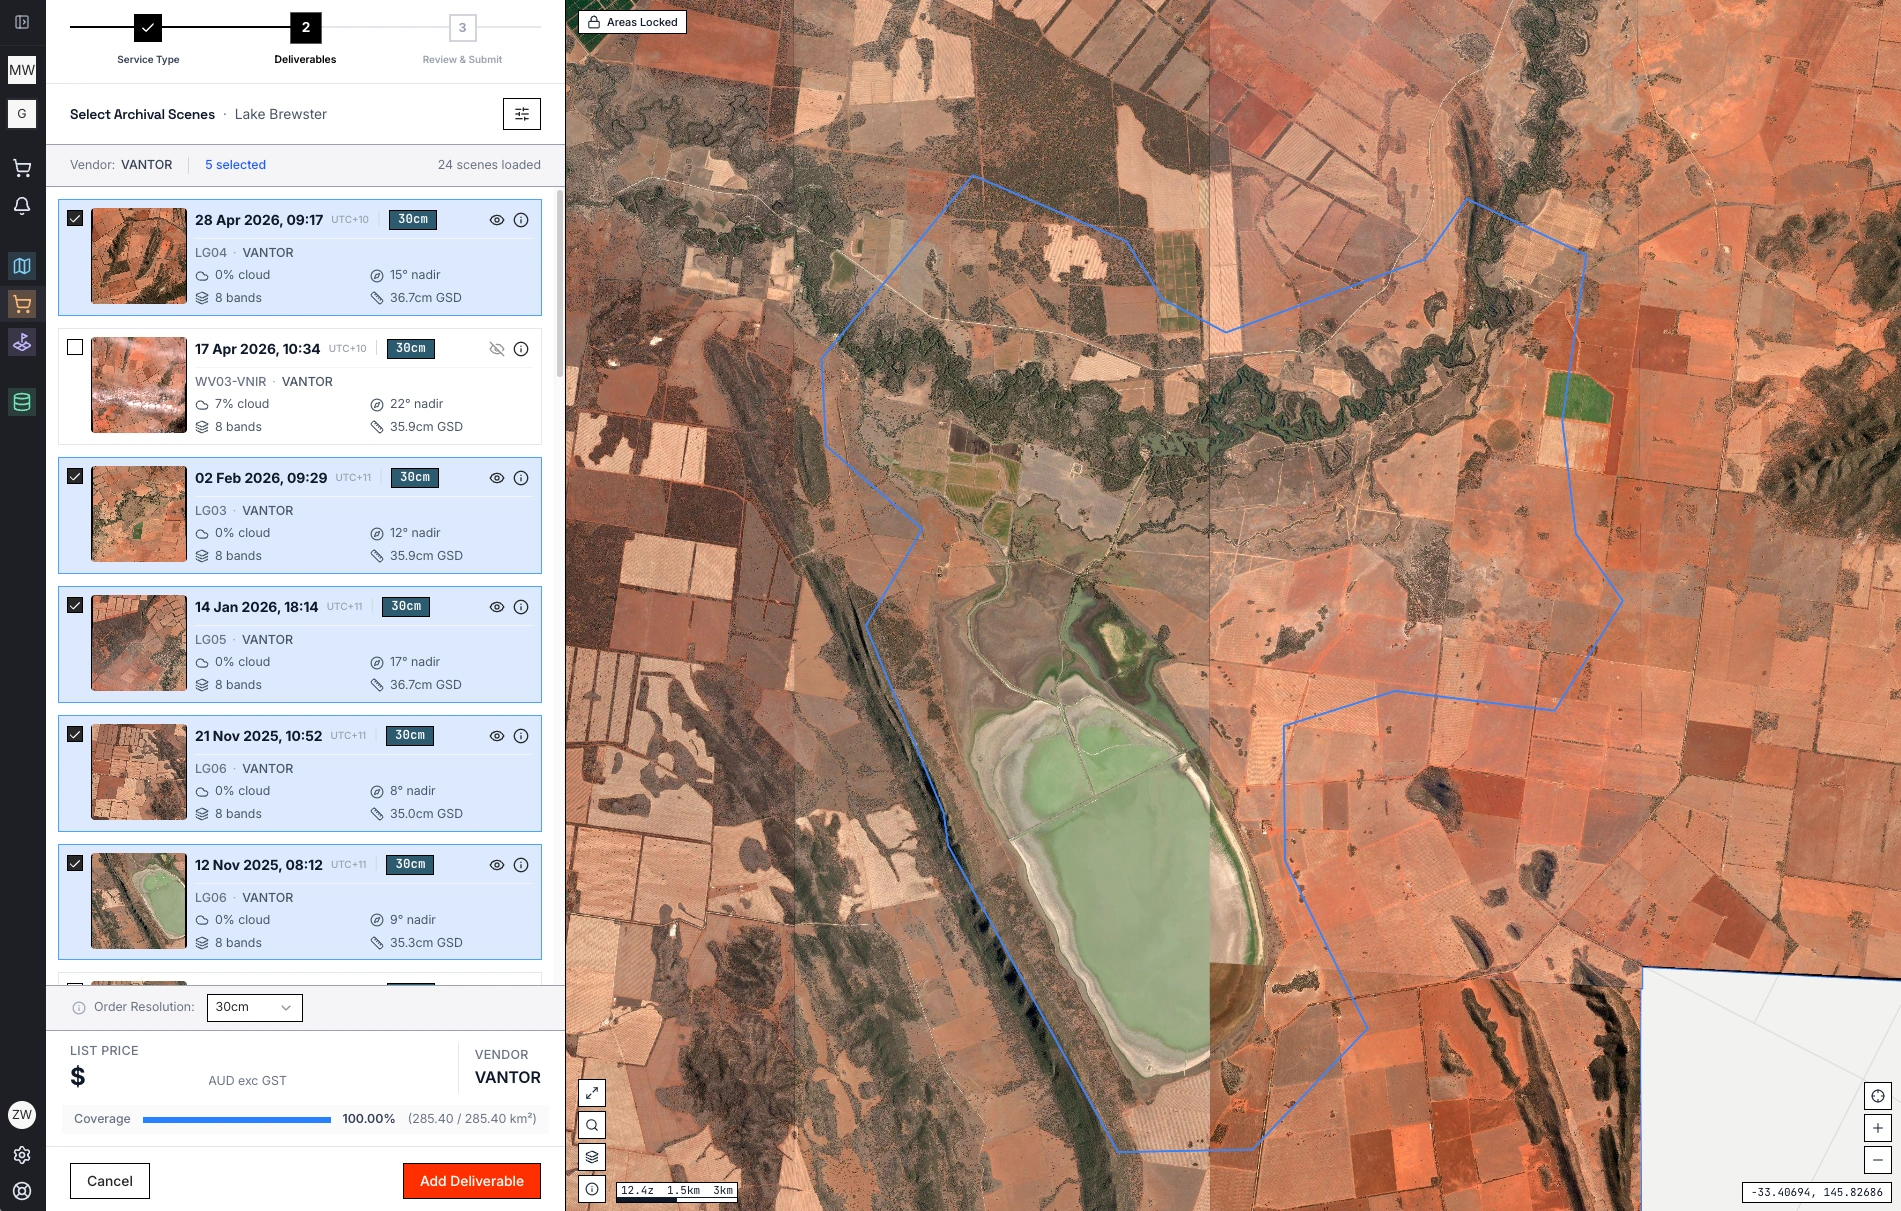
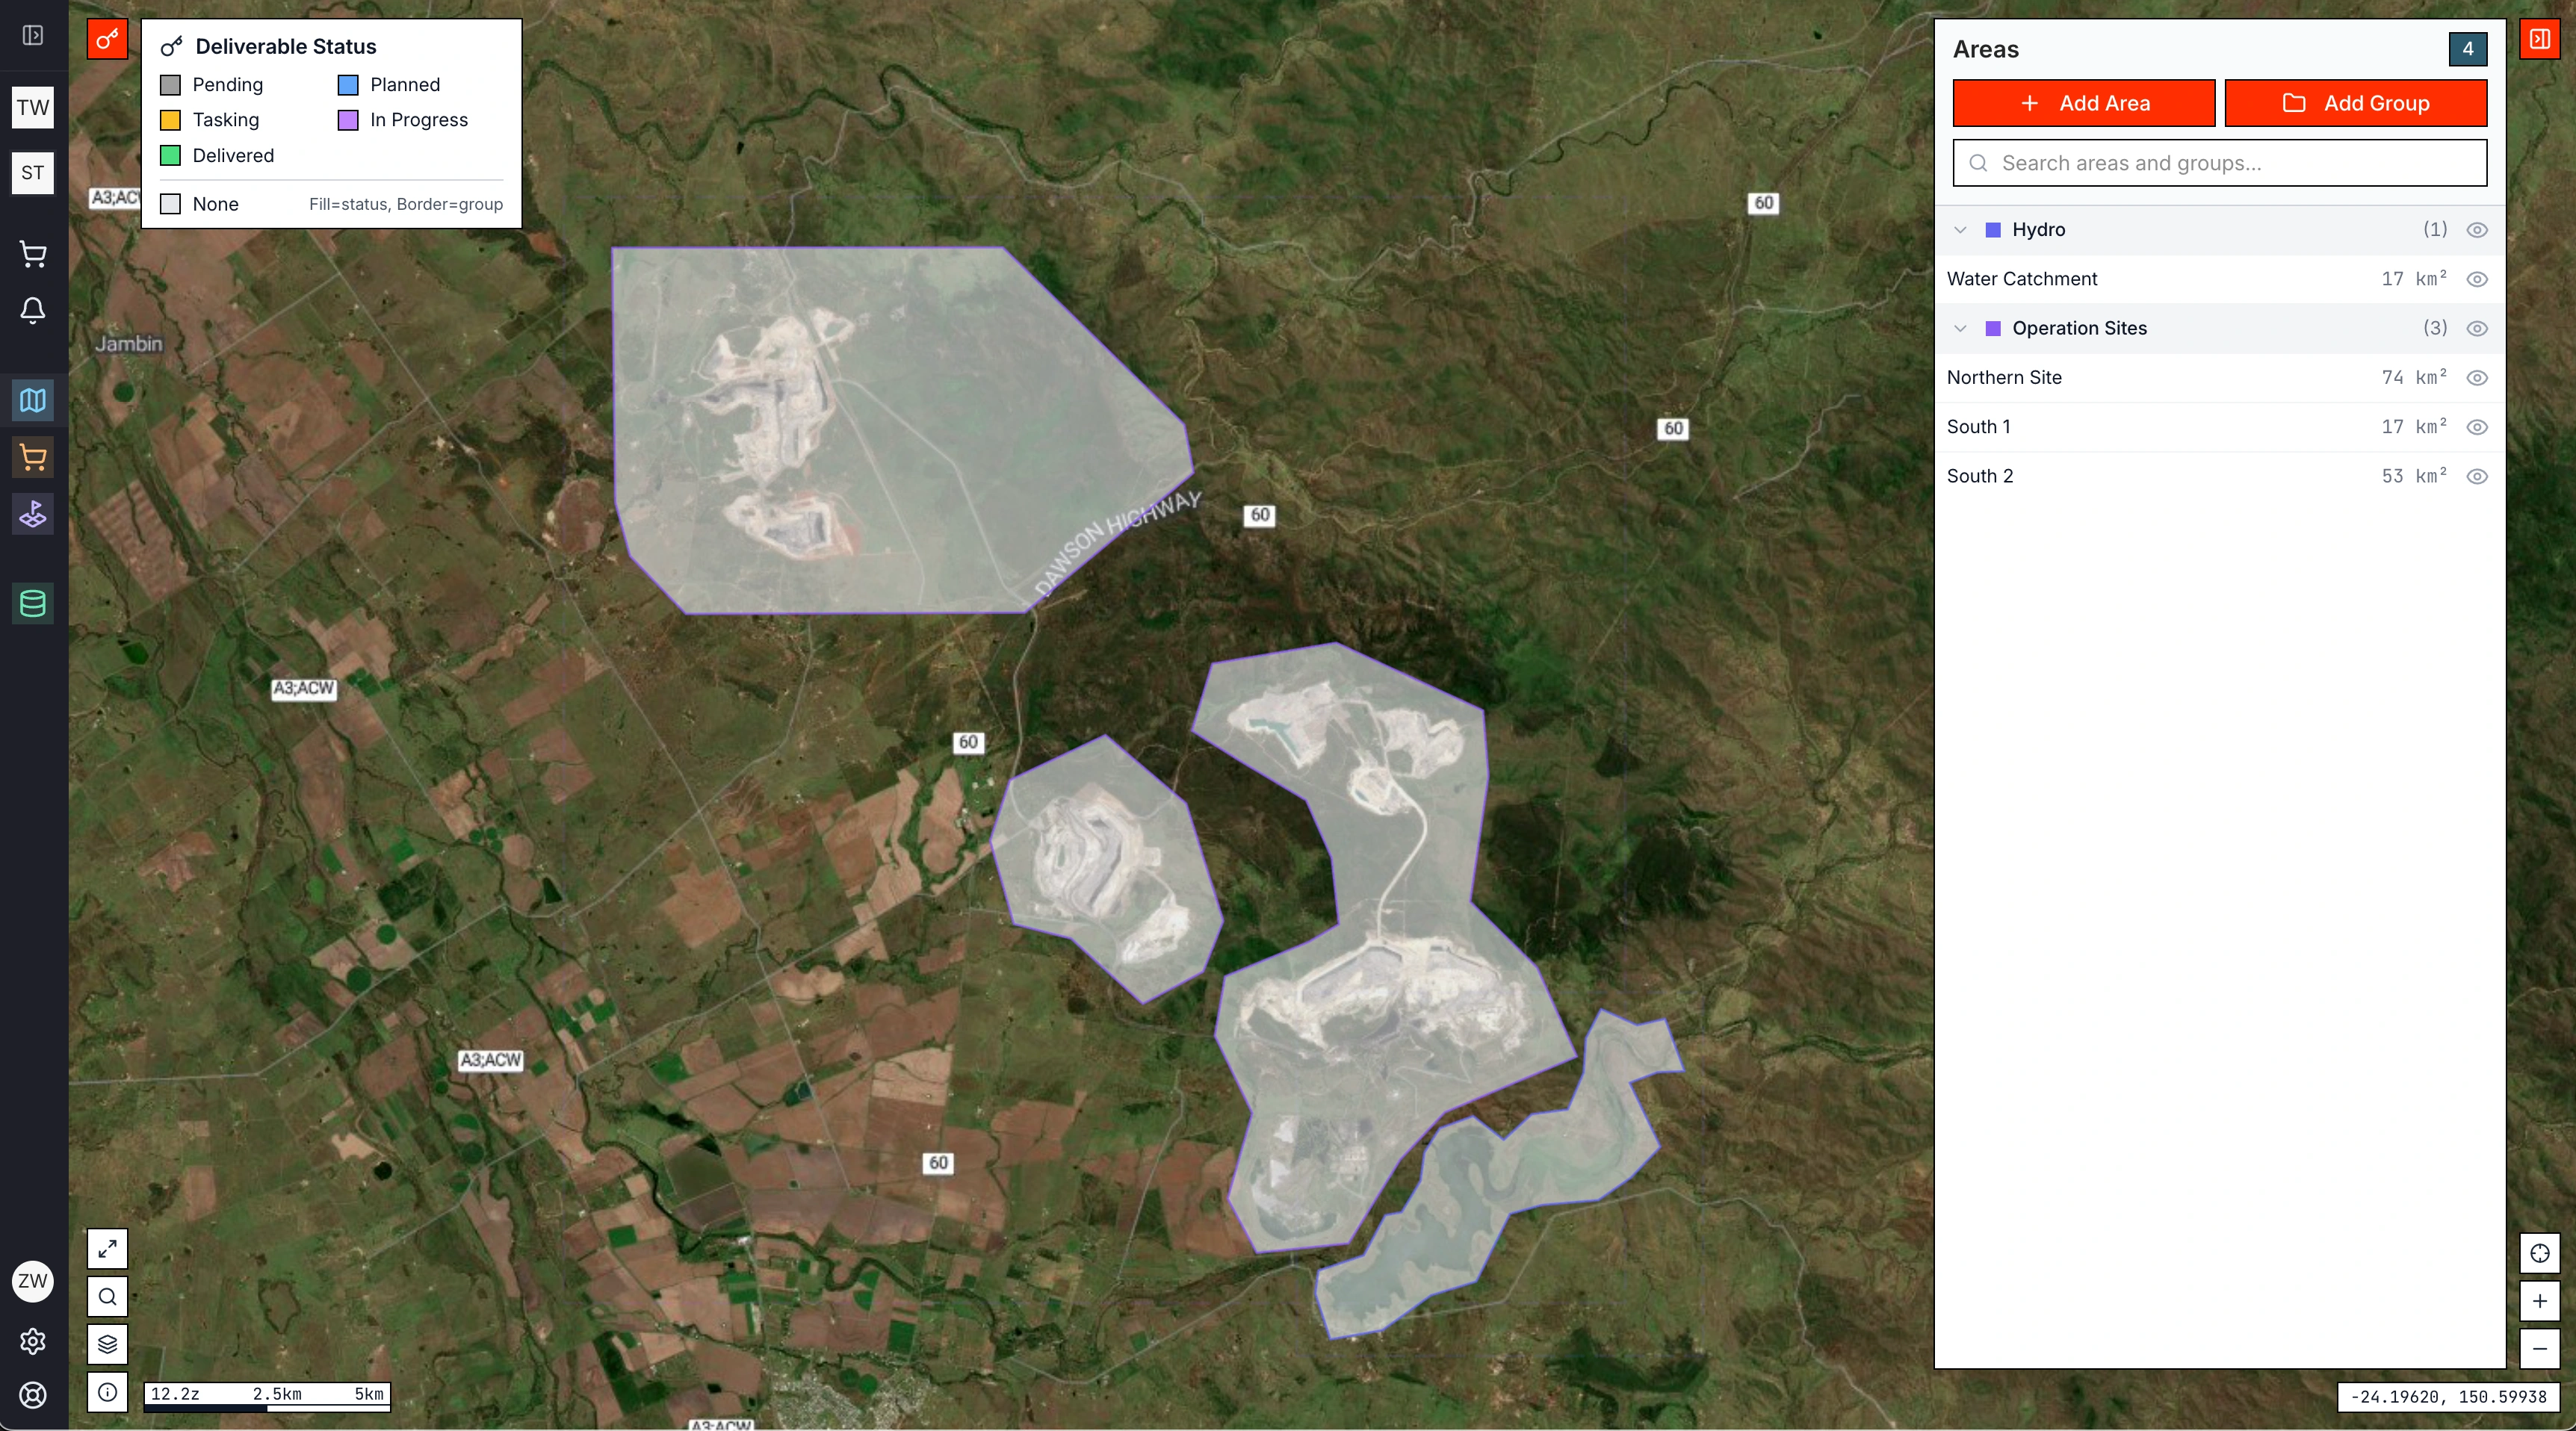
In practice, these steps come together in a single workspace, where areas of interest are defined, grouped and tracked from planning through to delivery:
Conclusion
Satellite imagery has become an indispensable tool for environmental monitoring, providing the coverage, frequency and analytical depth needed to understand and protect the natural environment at scale. By carefully selecting the right resolution, sensor type and acquisition strategy, organisations can build monitoring programs that deliver actionable insight rather than just raw data.
Whether the goal is tracking vegetation health, monitoring water quality or verifying rehabilitation progress, the right satellite solution comes down to matching sensor, resolution and acquisition strategy to the specific environmental question being asked.