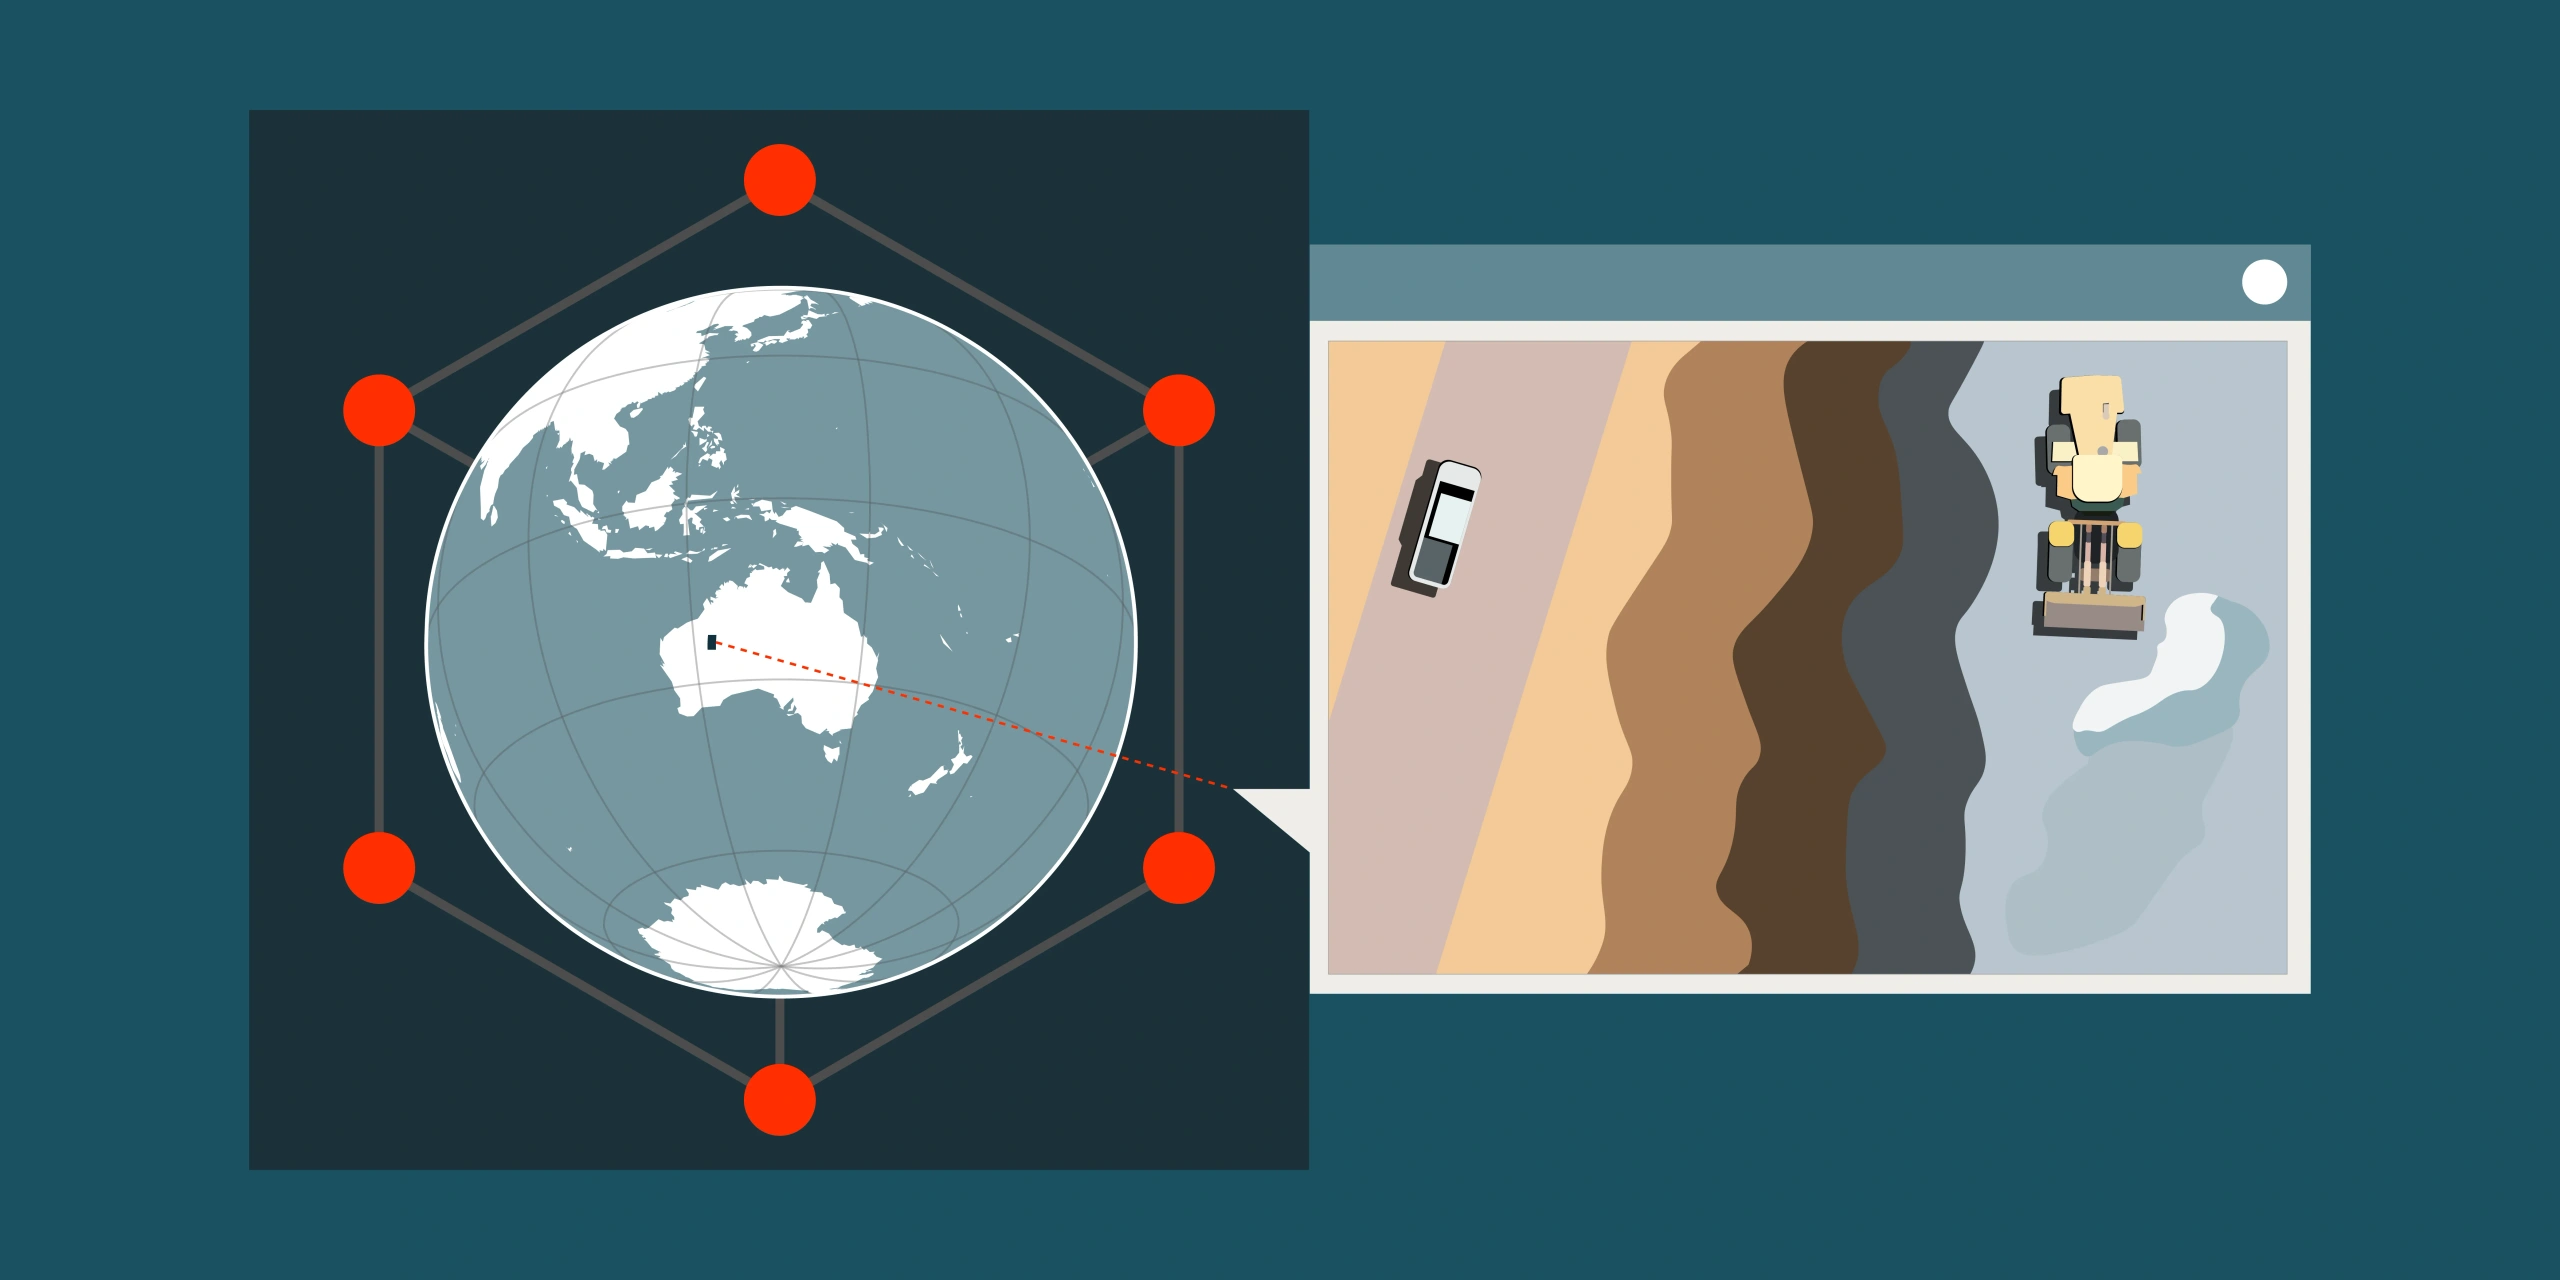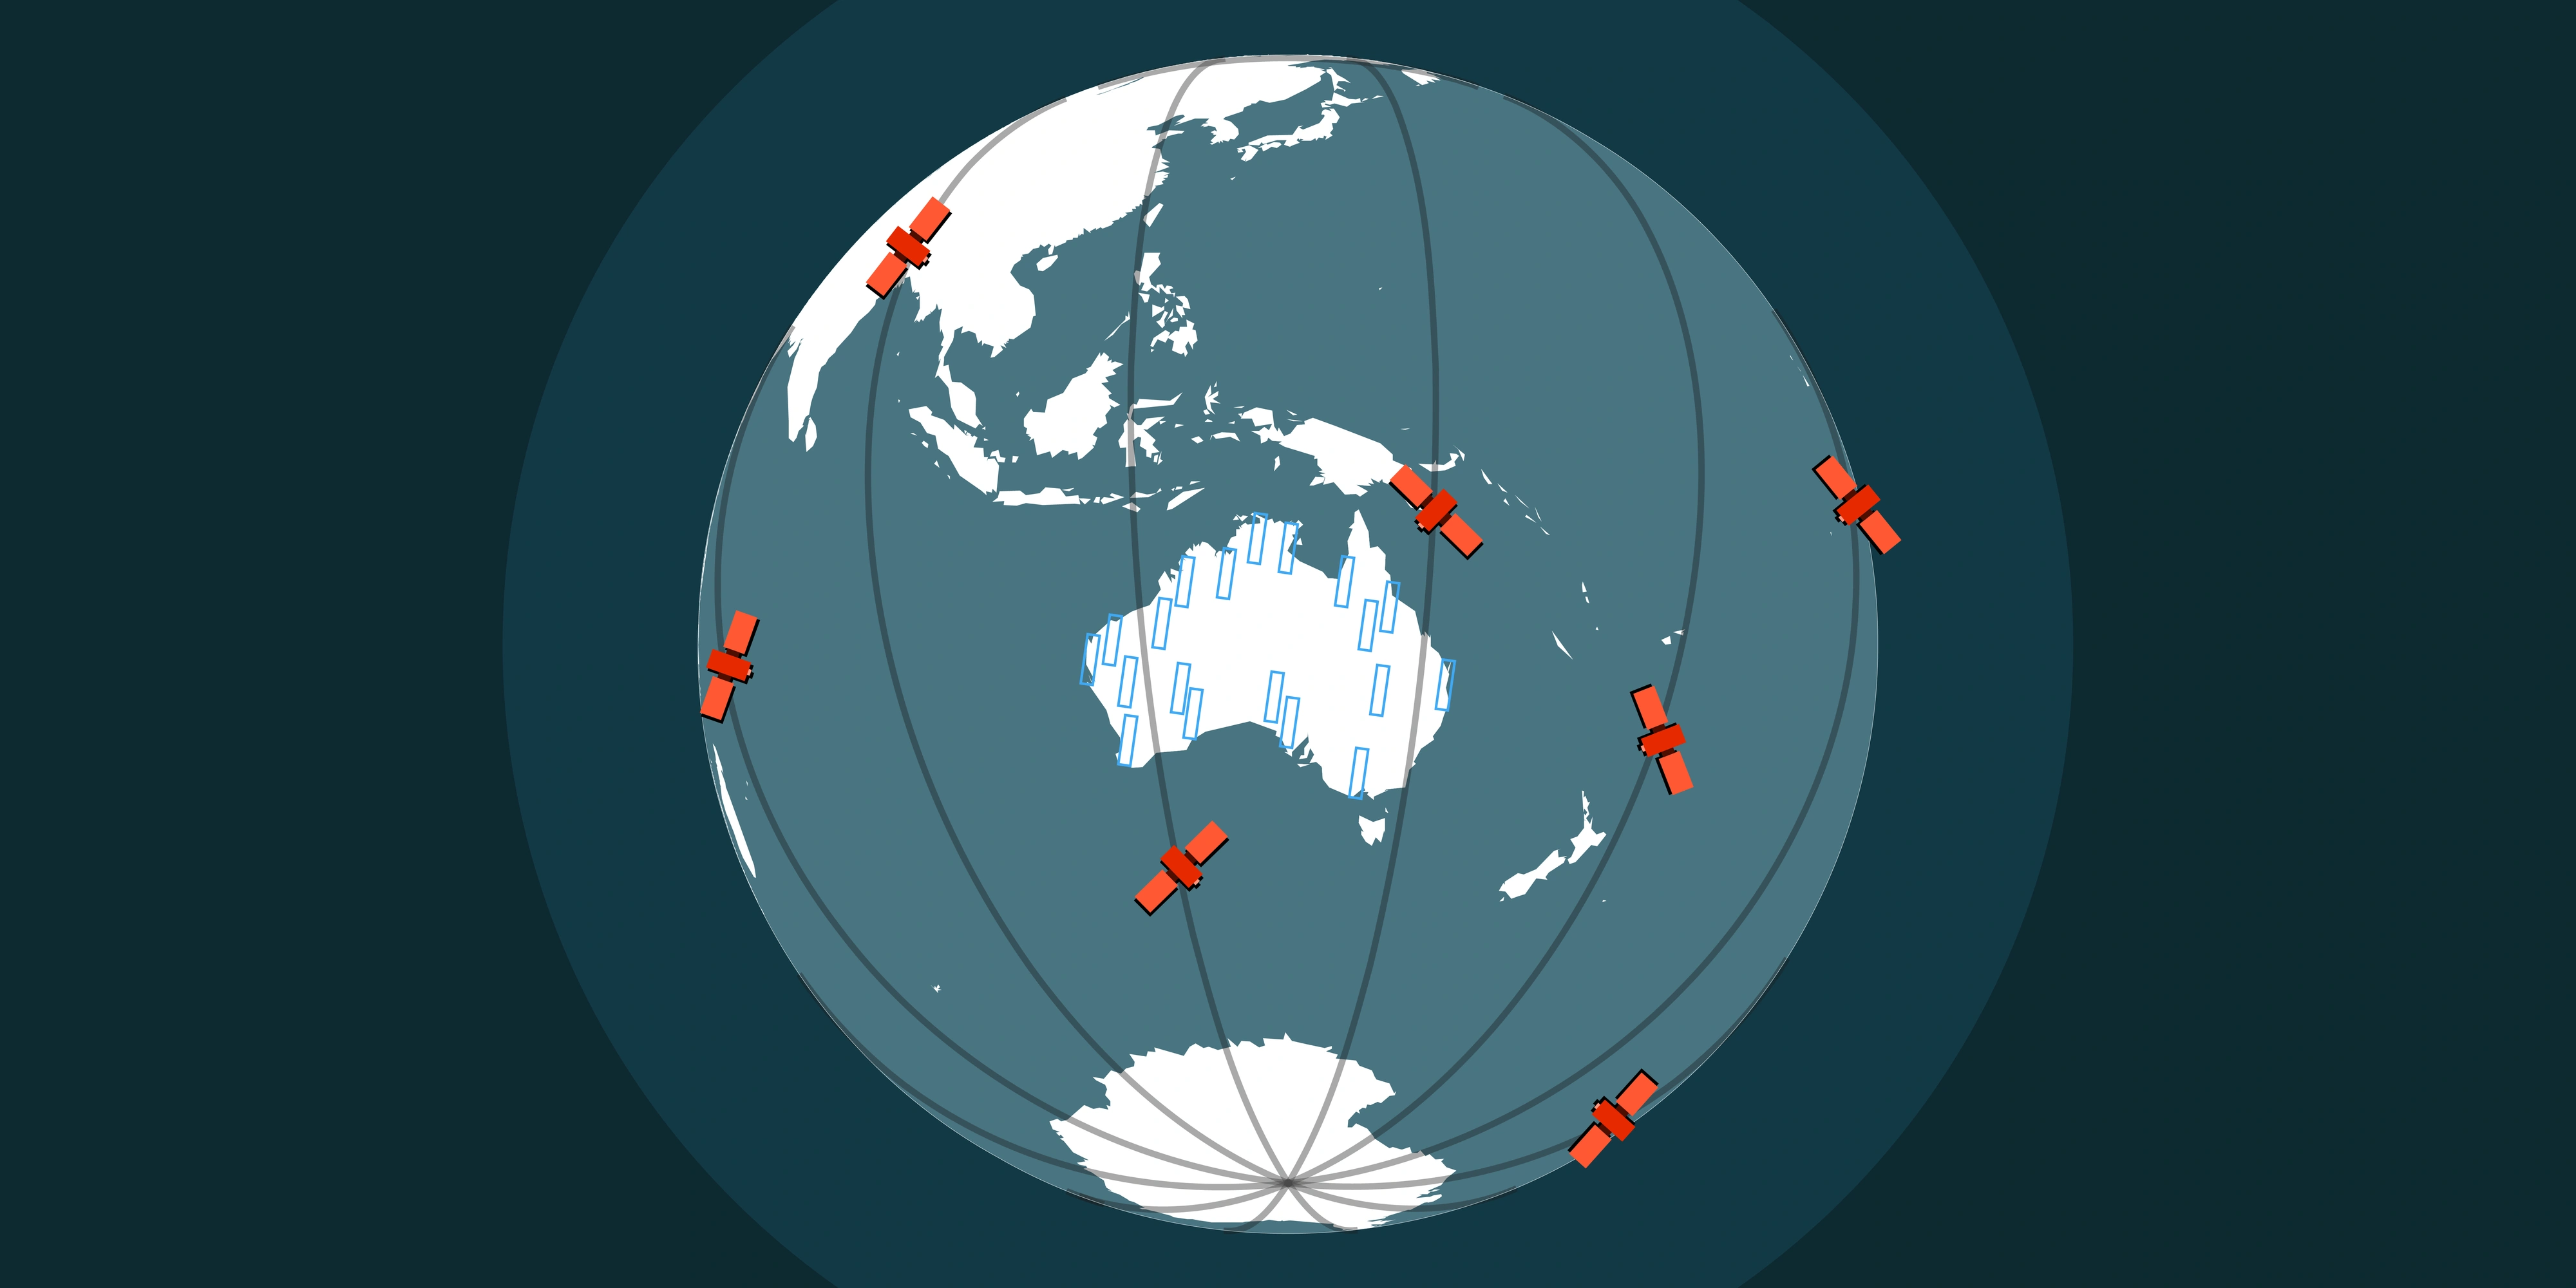
Satellite imagery is far more than just RGB. Earth-observation sensors capture multiple spectral bands - including near-infrared, red-edge, short-wave infrared and thermal infrared - allowing analysts to monitor vegetation stress, classify flora, detect water, map minerals, track rehabilitation and measure urban heat. At Terrabit, we routinely process multispectral and hyperspectral imagery to produce analysis-ready products for mining, environmental, infrastructure and government projects across Australia and globally.
This starter guide is a practical reference for some of the more popular band combinations and indices to show what they reveal, when to use them and the calculations behind them.
Band Combinations
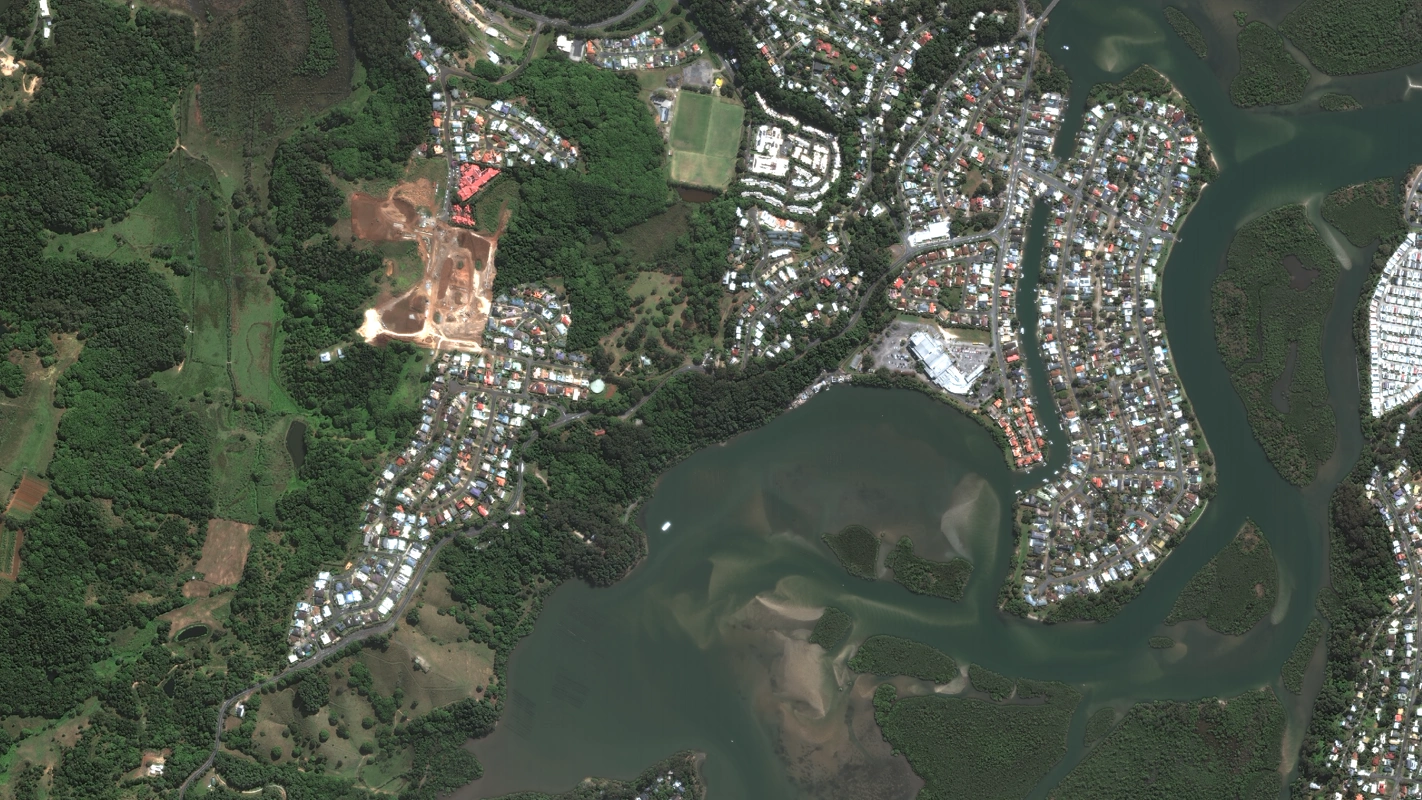
True Colour (RGB)
Bands: Red, Green, Blue
Use case: Visual inspection, mapping, reporting, baseline comparison
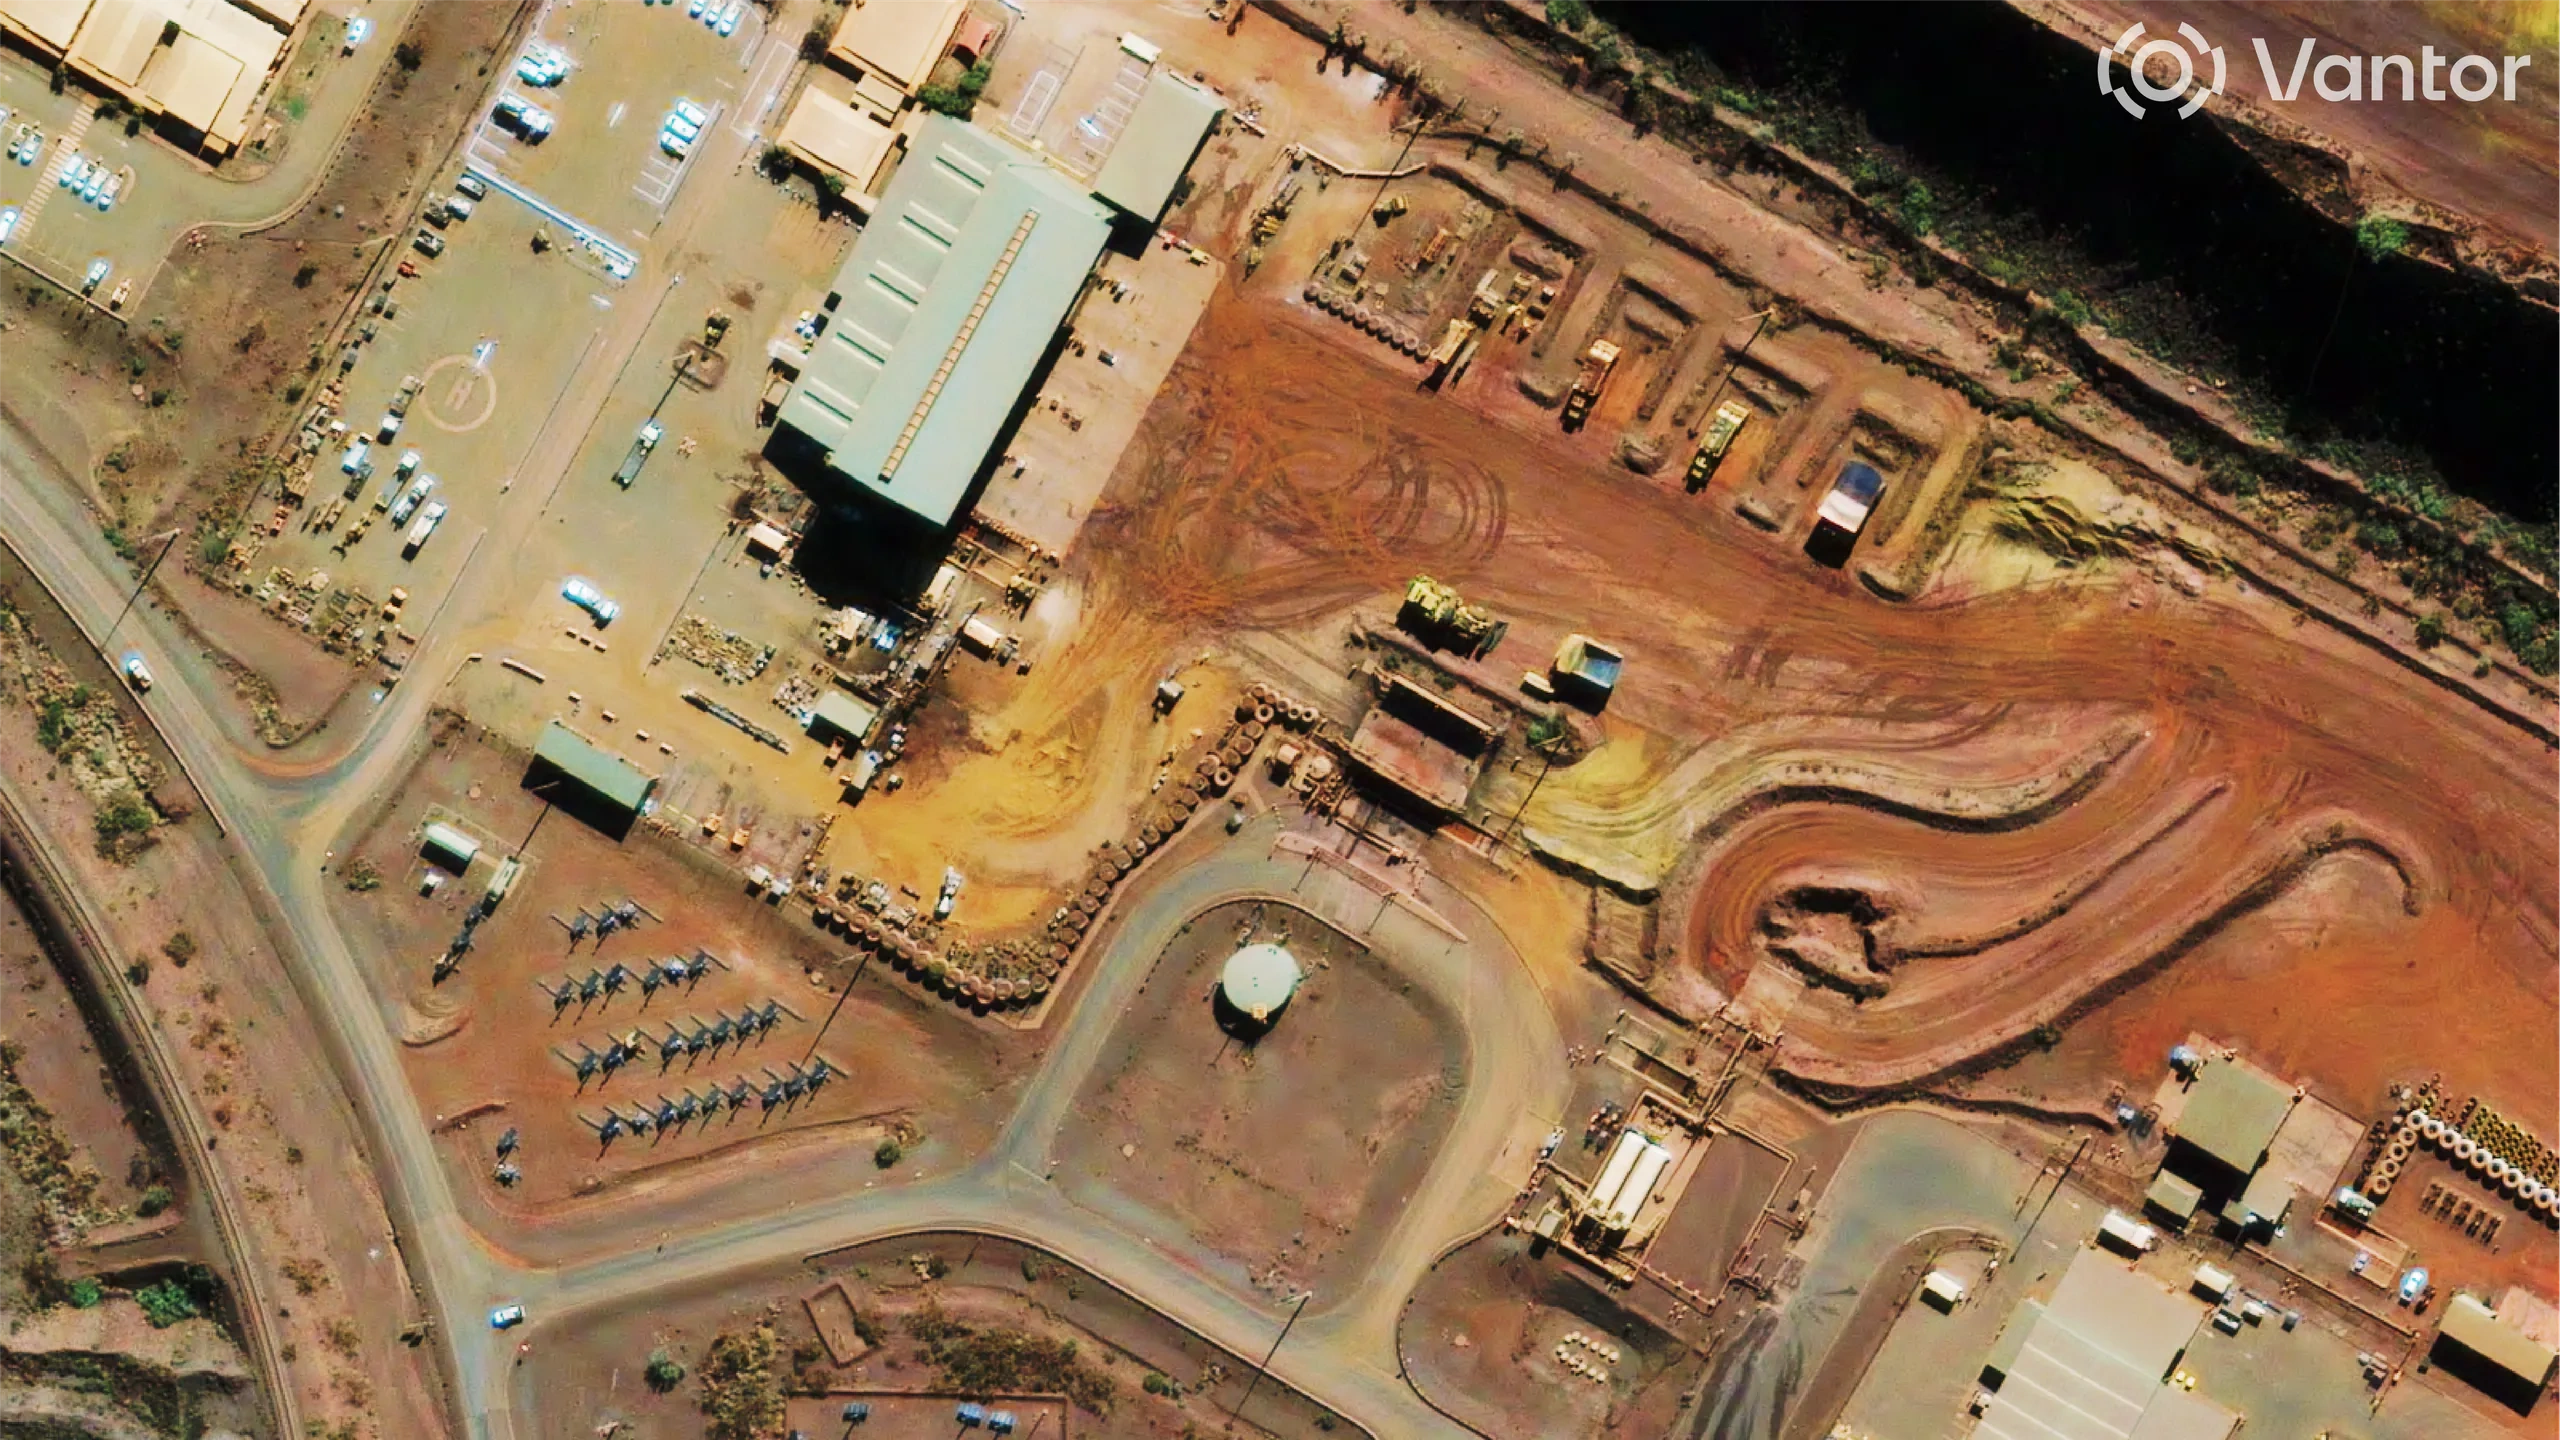
True colour imagery is what most people expect when they think of satellite data. It is ideal for basemaps, change detection, site inspections and general interpretation, but it does not reveal spectral information invisible to the human eye.
Typical applications: Infrastructure and mine monitoring, environmental baseline reporting, urban mapping, baseline comparison
High-resolution imagery from our vendor constellations can reach up to 30cm resolution, allowing identification of vehicles, stockpiles, disturbance boundaries and small structures.
| Satellite | Red Band | Green Band | Blue Band |
|---|---|---|---|
| Vantor - WorldView (8-band) | 5 | 3 | 2 |
| SIIS - KOMPSAT | 3 | 2 | 1 |
| Sentinel-2 | 4 | 3 | 2 |
| Landsat-8/9 | 4 | 3 | 2 |
Colour-Infrared (CIR)
Bands: Near Infrared, Red, Green
Use case: Vegetation health, land cover classification, rehabilitation monitoring
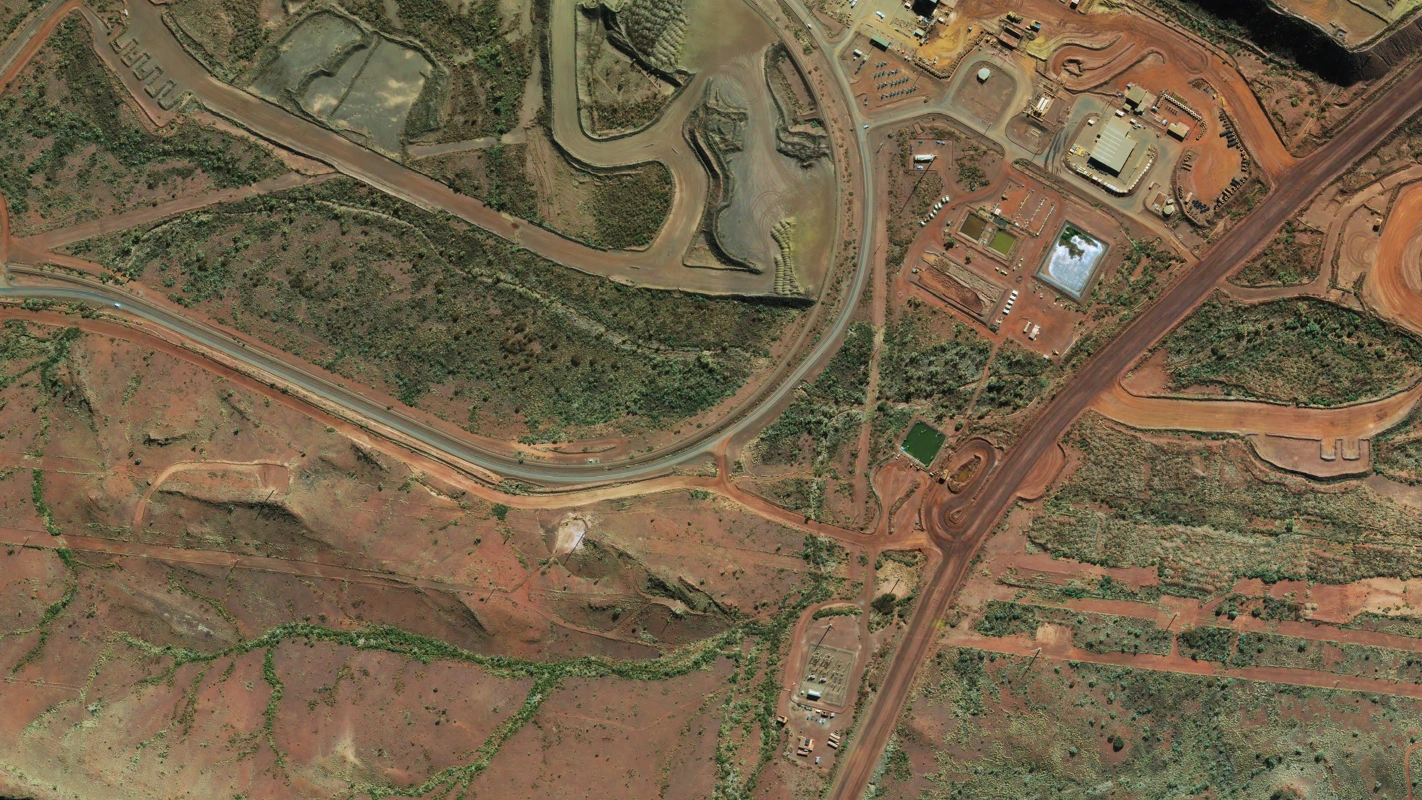
RGB
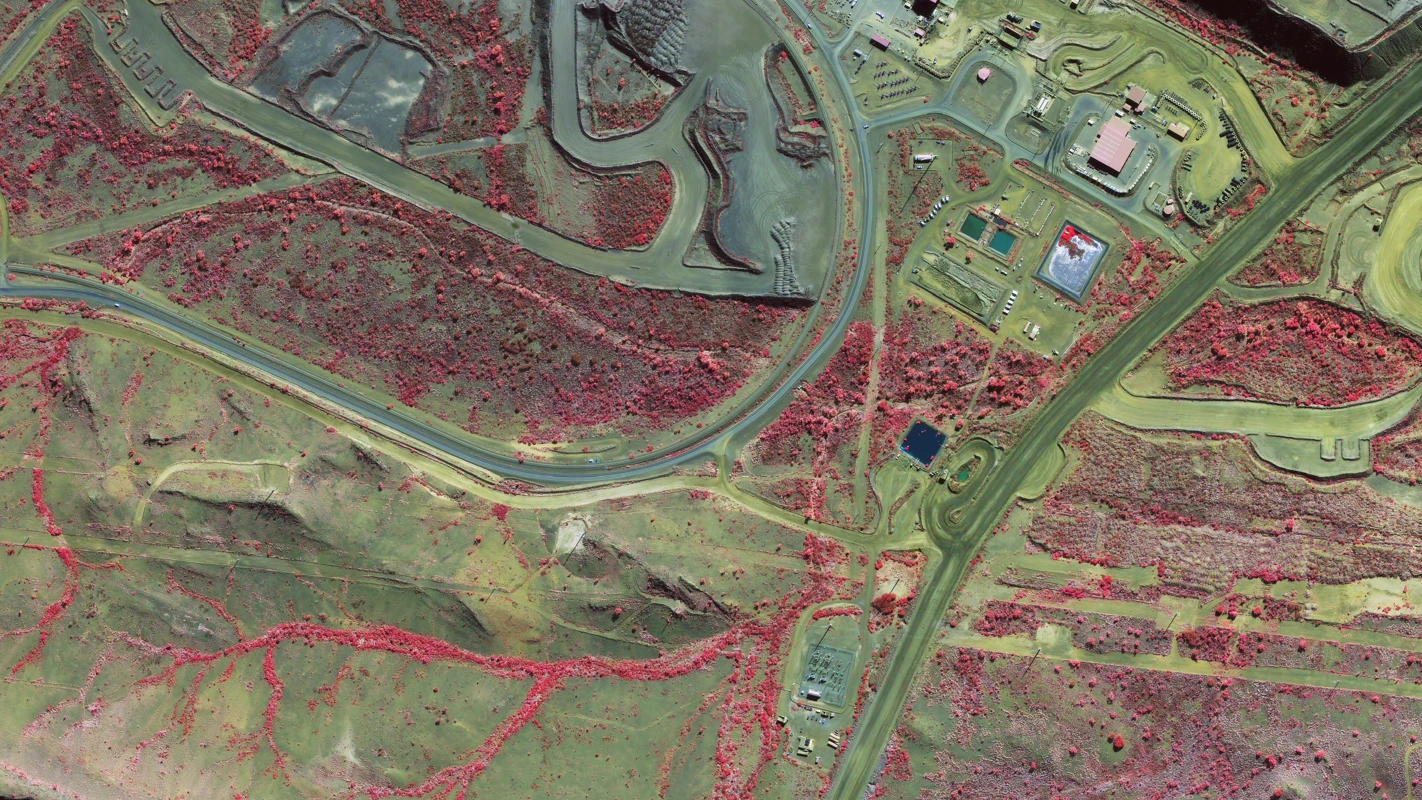
CIR
Healthy vegetation reflects a high level of near-infrared (NIR) while absorbing visible light. This band combination makes dense and vigorous vegetation appear as vibrant red and as plant vigour or chlorophyll levels decrease it will appear as less intense shades of red. Dead or very unhealthy plants will appear as green or tan.
This ability to visualise vegetation health makes it one of the most widely used band combinations for environmental monitoring and agriculture.
Typical applications: Rehabilitation progress at mine sites, crop condition and growth monitoring
Multispectral sensors with NIR capability enable vegetation mapping and environmental classification that cannot be seen in standard RGB imagery.
| Satellite | Red Band | Green Band | Blue Band |
|---|---|---|---|
| Vantor - WorldView-2/3 (8-band) | 7 | 5 | 3 |
| Vantor - WorldView Legion (8-band) | 8 | 5 | 3 |
| SIIS - KOMPSAT | 4 | 3 | 2 |
| Sentinel-2 | 8 | 4 | 3 |
| Landsat-8/9 | 5 | 4 | 3 |
Shortwave Infrared (SWIR)
Bands: SWIR, Near Infrared, Red
Use case: Lithological mapping, reviewing fire damage and extents
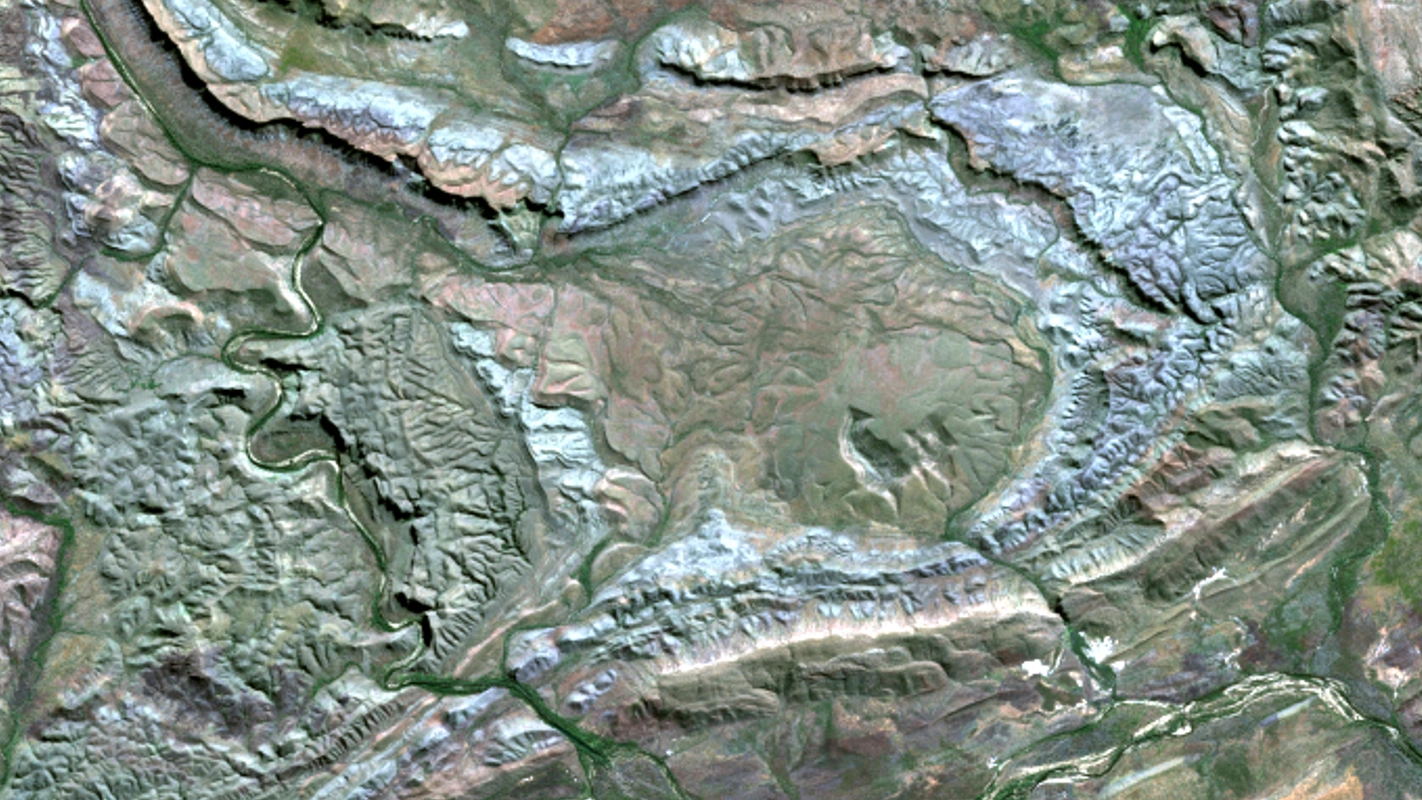
RGB
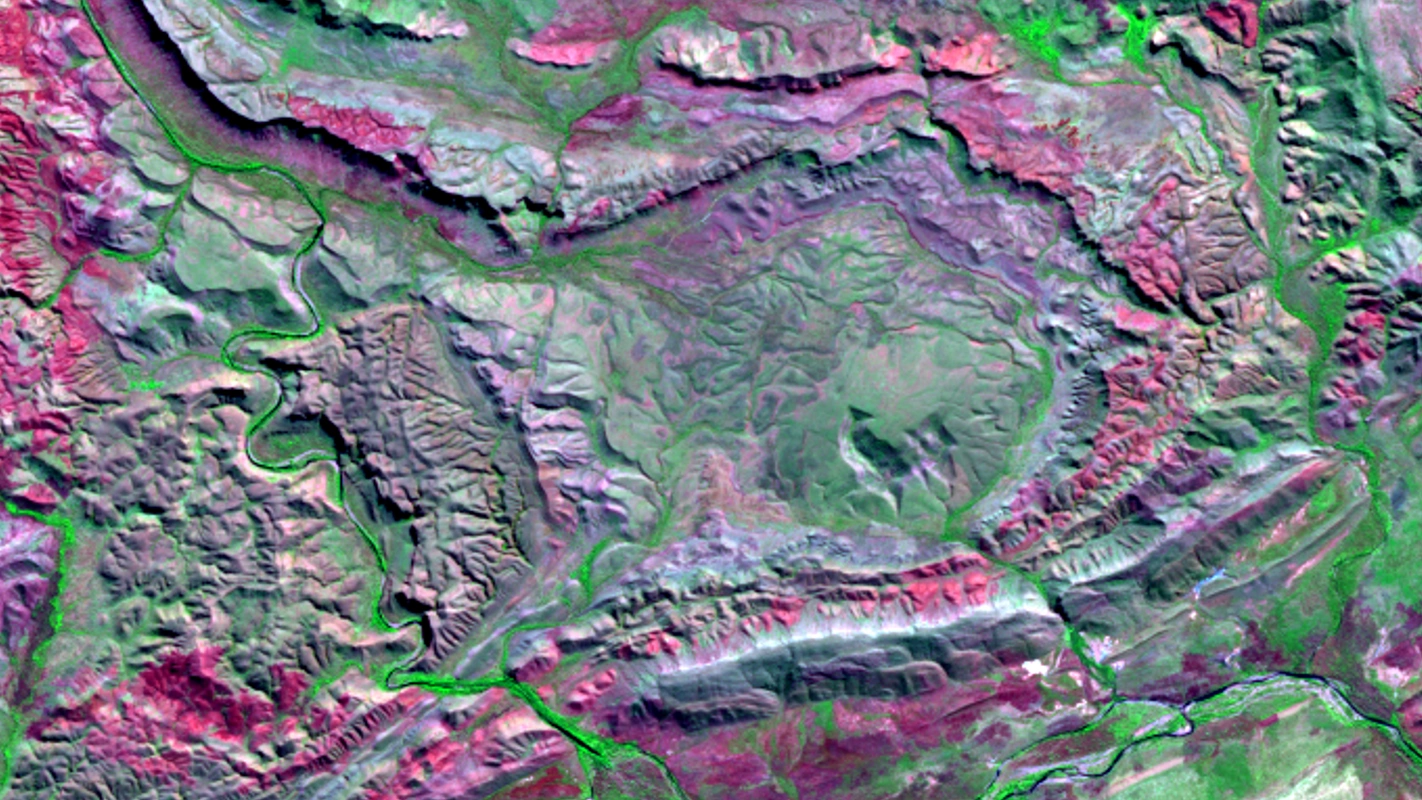
SWIR
The Shortwave Infrared band combination is particularly powerful for geological applications because minerals and rock-forming materials exhibit distinct reflectance signatures across the SWIR2, NIR, and Red wavelengths. Lithological boundaries that are invisible in true colour become delineated. This makes SWIR composites a valuable tool in geological remote sensing for mapping rock unit boundaries, identifying alteration zones and characterising surface mineralogy across large areas.
The combination is also effective for distinguishing fire damage, as burned land reflects highly in the SWIR wavelengths, making burn scar boundaries clearly distinguishable from surrounding unaffected terrain.
| Satellite | Red Band | Green Band | Blue Band |
|---|---|---|---|
| Vantor - WorldView-3 (16-band) | 14 | 7 | 5 |
| Sentinel-2 | 12 | 8 | 4 |
| Landsat-8/9 | 7 | 5 | 4 |
Indices
Normalised Difference Vegetation Index (NDVI)
Formula: (NIR − Red) / (NIR + Red)
Use case: Vegetation health, crop monitoring, environmental compliance, land management
RGB
NDVI
NDVI is one of the most common spectral indices. Healthy vegetation reflects near-infrared and absorbs red light, producing high NDVI values while areas without vegetation will have very low or negative values.
Interpretation guide:
- 0.6 – 1.0 → Dense and healthy vegetation
- 0.4 – 0.6 → Moderate vegetation
- 0.1 – 0.4 → Sparse or stressed vegetation
- < 0.1 → No vegetation (bare earth / water / urban)
CIR
NDVI
Note: NDVI can return erroneous values particularly in areas with low vegetation cover. A soil adjustment factor (L) can be applied to the NDVI index to reduce this - this index is known as Soil Adjusted Vegetation Index (SAVI).
The Modified Soil Adjusted Vegetation Index (MSAVI2) is designed to extend the application limits of NDVI to images with a high proportion of bare earth. It aims to correct for soil brightness while removing the need to adjust the soil adjustment factor for each dataset. MSAVI2 is recommended for the early stages of plant development such as rehabilitation or just after crop seeding.
Typical applications: Mine rehabilitation tracking, agricultural monitoring, environmental impact studies and drought/stress detection
| Satellite | Formula (Band Number) |
|---|---|
| Vantor - WorldView-2/3 (8-band) | (7 − 5) / (7 + 5) |
| Vantor - WorldView Legion (8-band) | (8 − 5) / (8 + 5) |
| SIIS - KOMPSAT | (4 − 3) / (4 + 3) |
| Sentinel-2 | (8 − 4) / (8 + 4) |
| Landsat-8/9 | (5 − 4) / (5 + 4) |
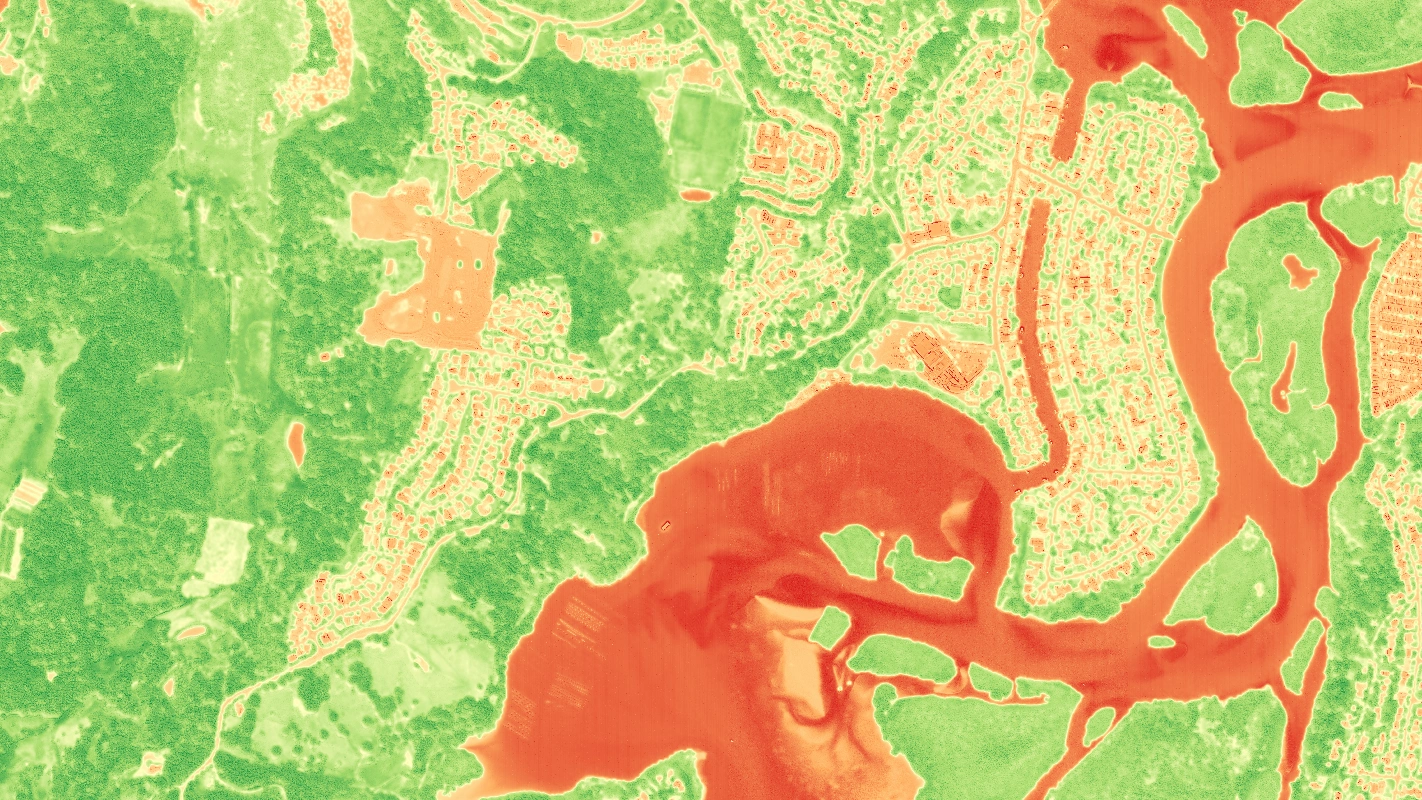
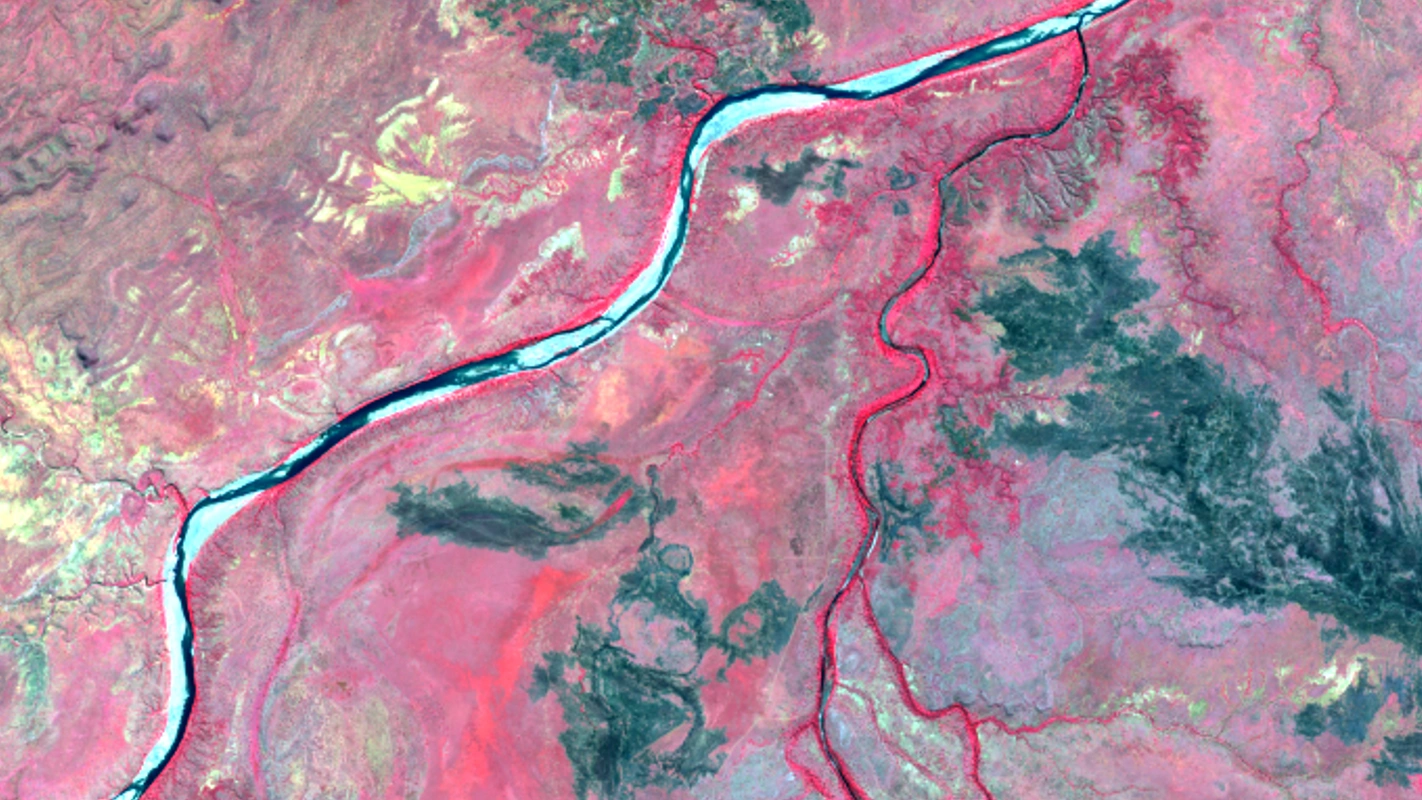
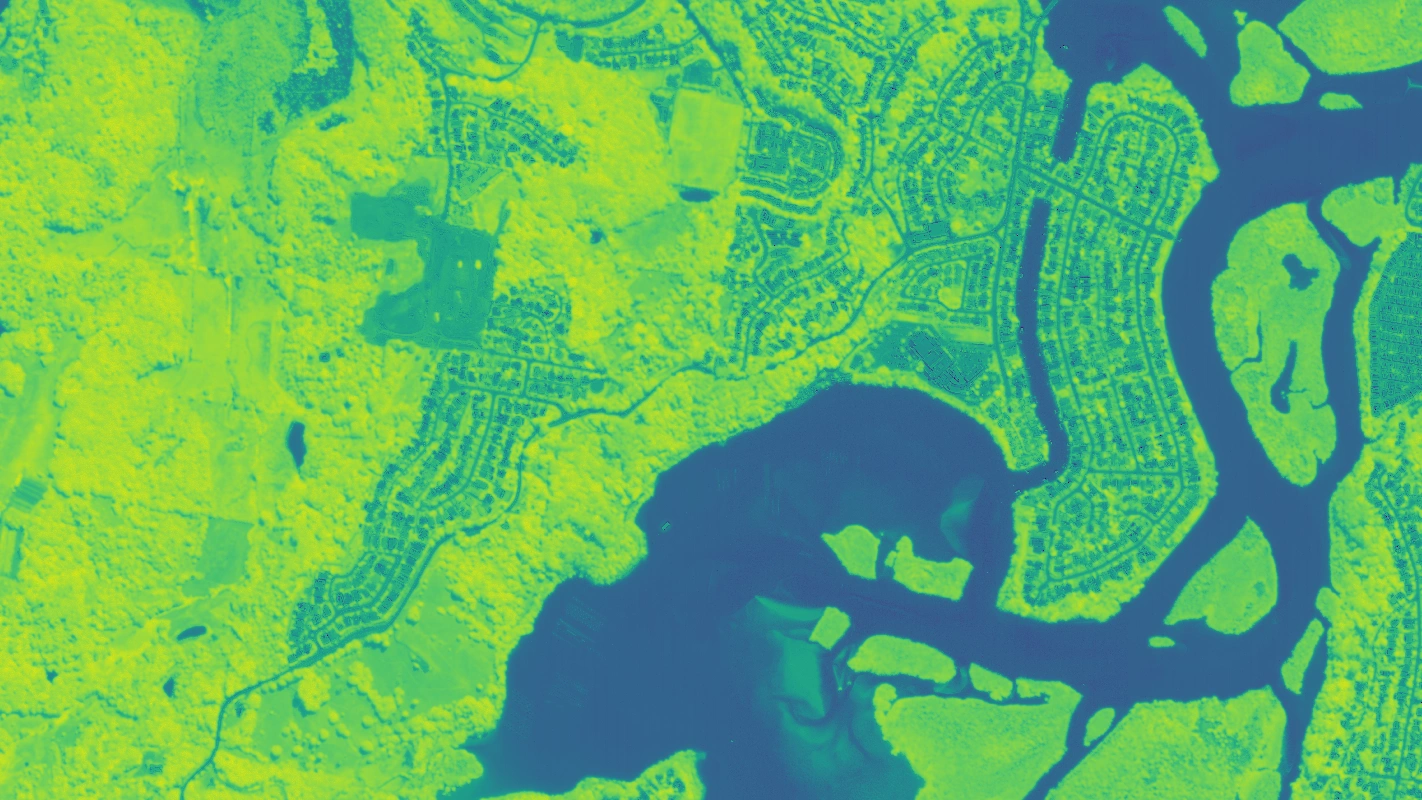
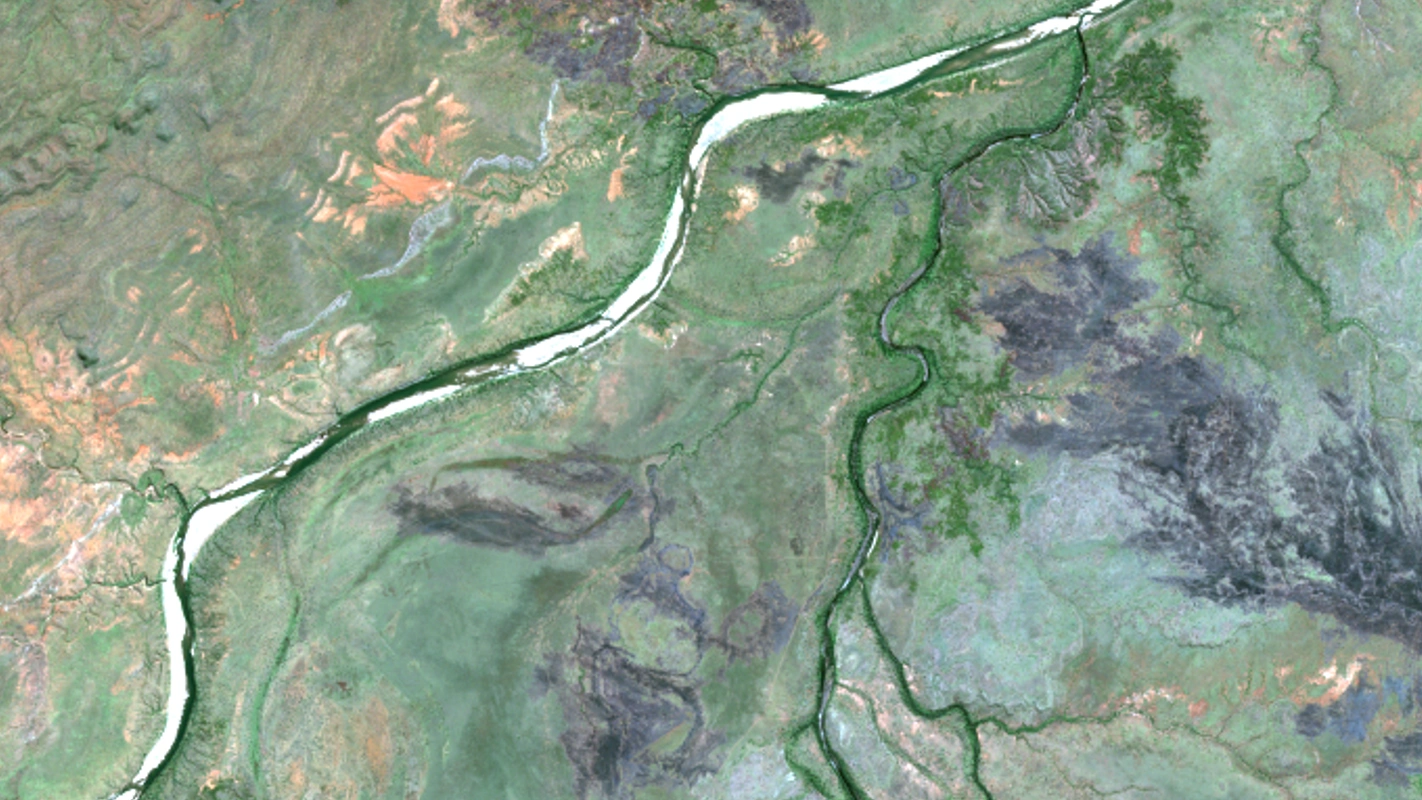
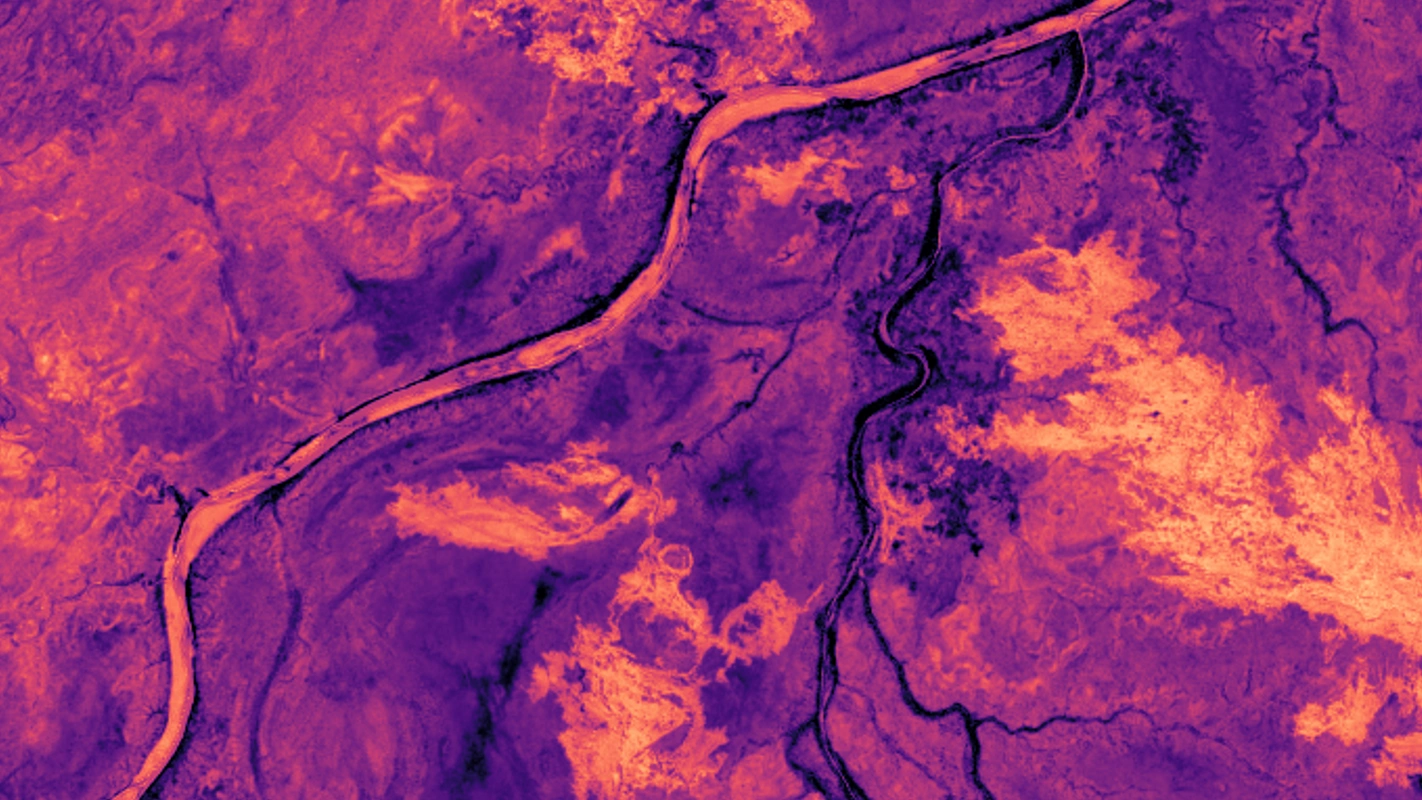
Normalised Difference Water Index (NDWI)
Formula: (Green − NIR) / (Green + NIR)
Use case: Water detection, wetland mapping, flood extent
RGB
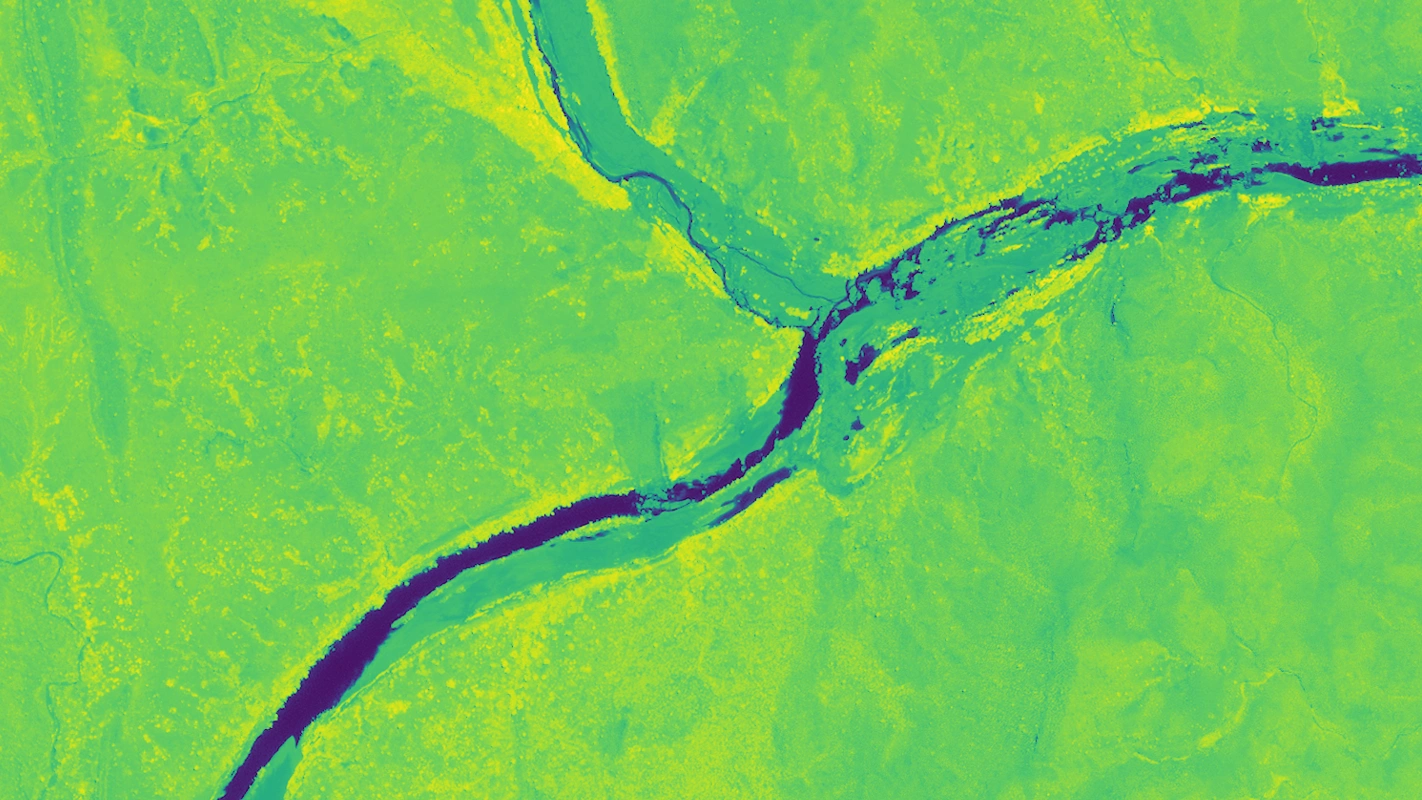
NDWI
Water absorbs near-infrared and reflects green, making it possible to separate from land using NDWI. Values above 0.3 will generally represent moderate water content such as wetlands while anything greater than 0.5 often indicates open water.
Note: There is a Modified Normalized Difference Water Index (MNDWI) that uses Green and SWIR bands:
MNDWI = (Green − SWIR) / (Green + SWIR).
If you have SWIR bands available this index can improve accuracy by differentiating built-up areas that are often detected as open water in NDWI.
RGB
NDWI
Typical applications: Flood response, coastal monitoring, environmental compliance, tailings and water storage monitoring
| Satellite | Formula (Band Number) |
|---|---|
| Vantor - WorldView-2/3 (8-band) | (3 − 7) / (3 + 7) |
| Vantor - WorldView Legion (8-band) | (3 − 8) / (3 + 8) |
| SIIS - KOMPSAT | (2 − 4) / (2 + 4) |
| Sentinel-2 | (3 − 8) / (3 + 8) |
| Landsat-8/9 | (3 − 5) / (3 + 5) |
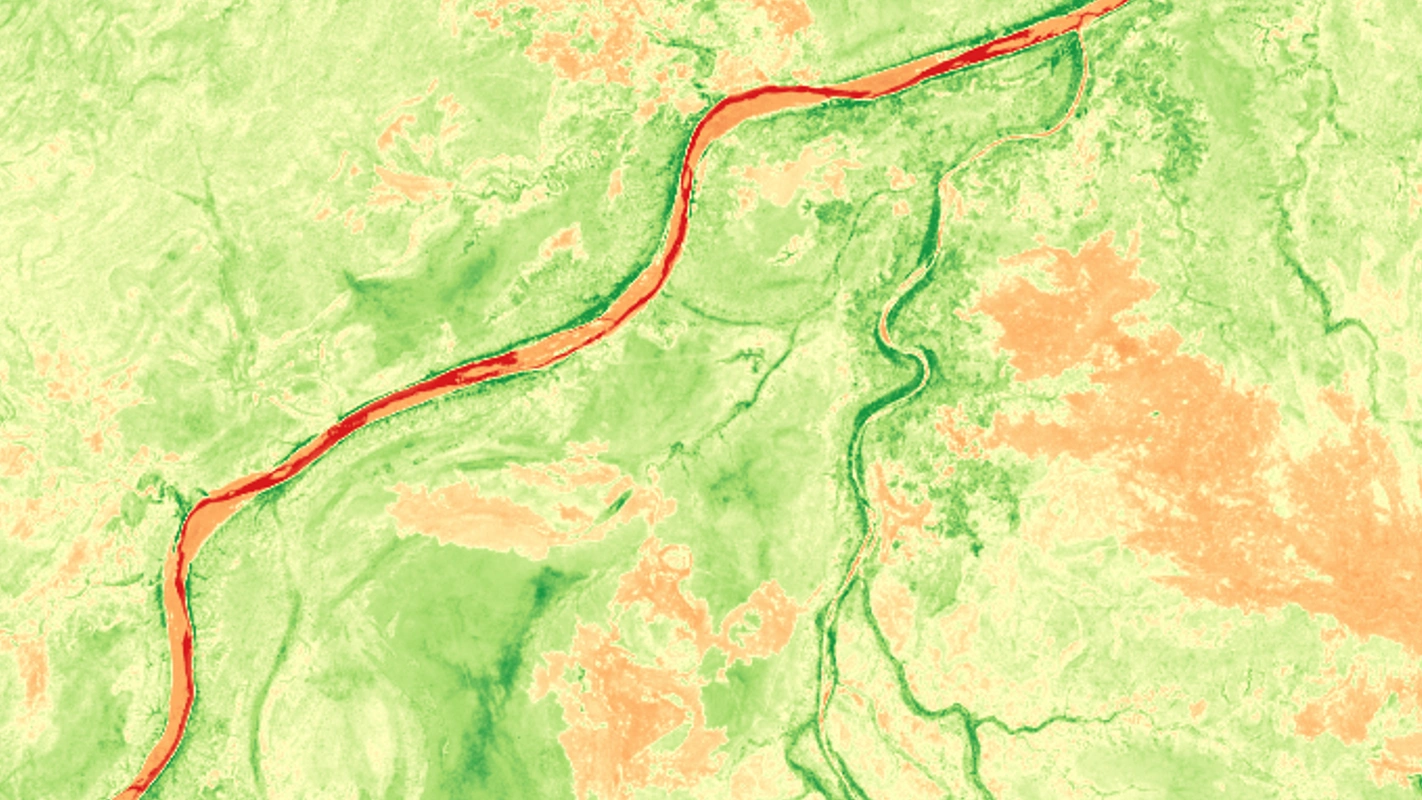
Normalised Burn Ratio (NBR)
Formula: (NIR − SWIR) / (NIR + SWIR)
Use case: Fire damage, burn severity, vegetation loss, recovery monitoring
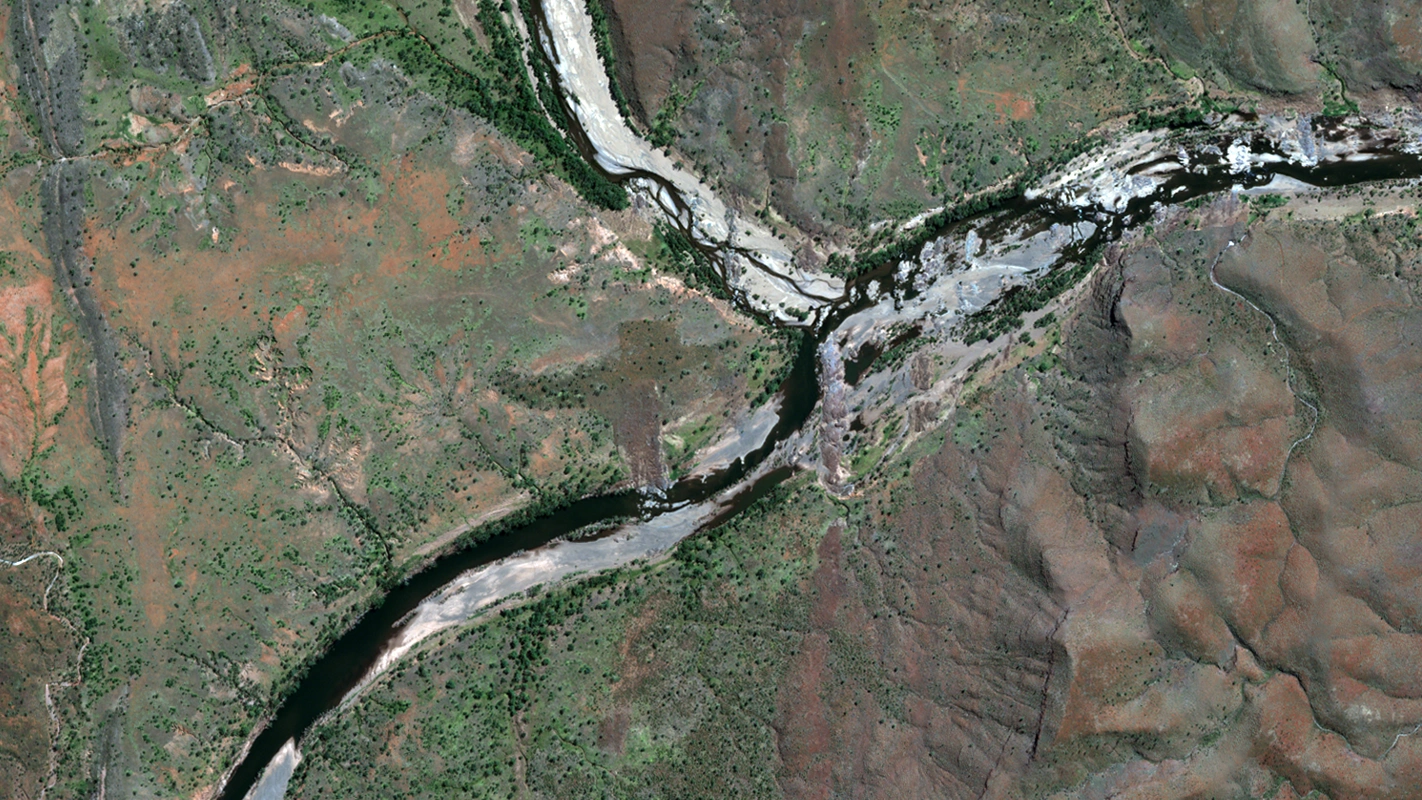
RGB
NBR
Healthy green vegetation will have a high Normalised Burn Ratio value while burnt areas will have a low value. Areas of dry, brown vegetation or bare soil will also return lower NBR values than green vegetation.
Note: Burn severity can be estimated using the difference between a pre-fire and post-fire NBR by calculating the delta NBR (dNBR):
dNBR = preNBR − postNBR.
Burnt areas will have a positive dNBR value while unburnt areas will have a negative or close to zero value.
Typical applications: Forest and bush fire damage assessment and mapping, emergency response
SWIR bands are available on Landsat and Sentinel data and advanced very high resolution sensors such as WorldView-3, enabling mineral and natural disaster analysis beyond standard multispectral imagery.
| Satellite | Formula (Band Number) |
|---|---|
| Vantor - WorldView-3 (16-band) | (7 − 14) / (7 + 14) |
| Sentinel-2 | (8 − 12) / (8 + 12) |
| Landsat-8/9 | (3 − 5) / (3 + 5) |
Why Band Combinations Matter
Different band combinations allow the same satellite capture to answer completely different questions.
| Goal | Best Combination |
|---|---|
| Visual inspection | RGB |
| Vegetation health | NDVI and Colour-Infrared |
| Water detection | NDWI |
| Fire damage | NBR and SWIR |
| Mineral / soil mapping | SWIR and RGB |
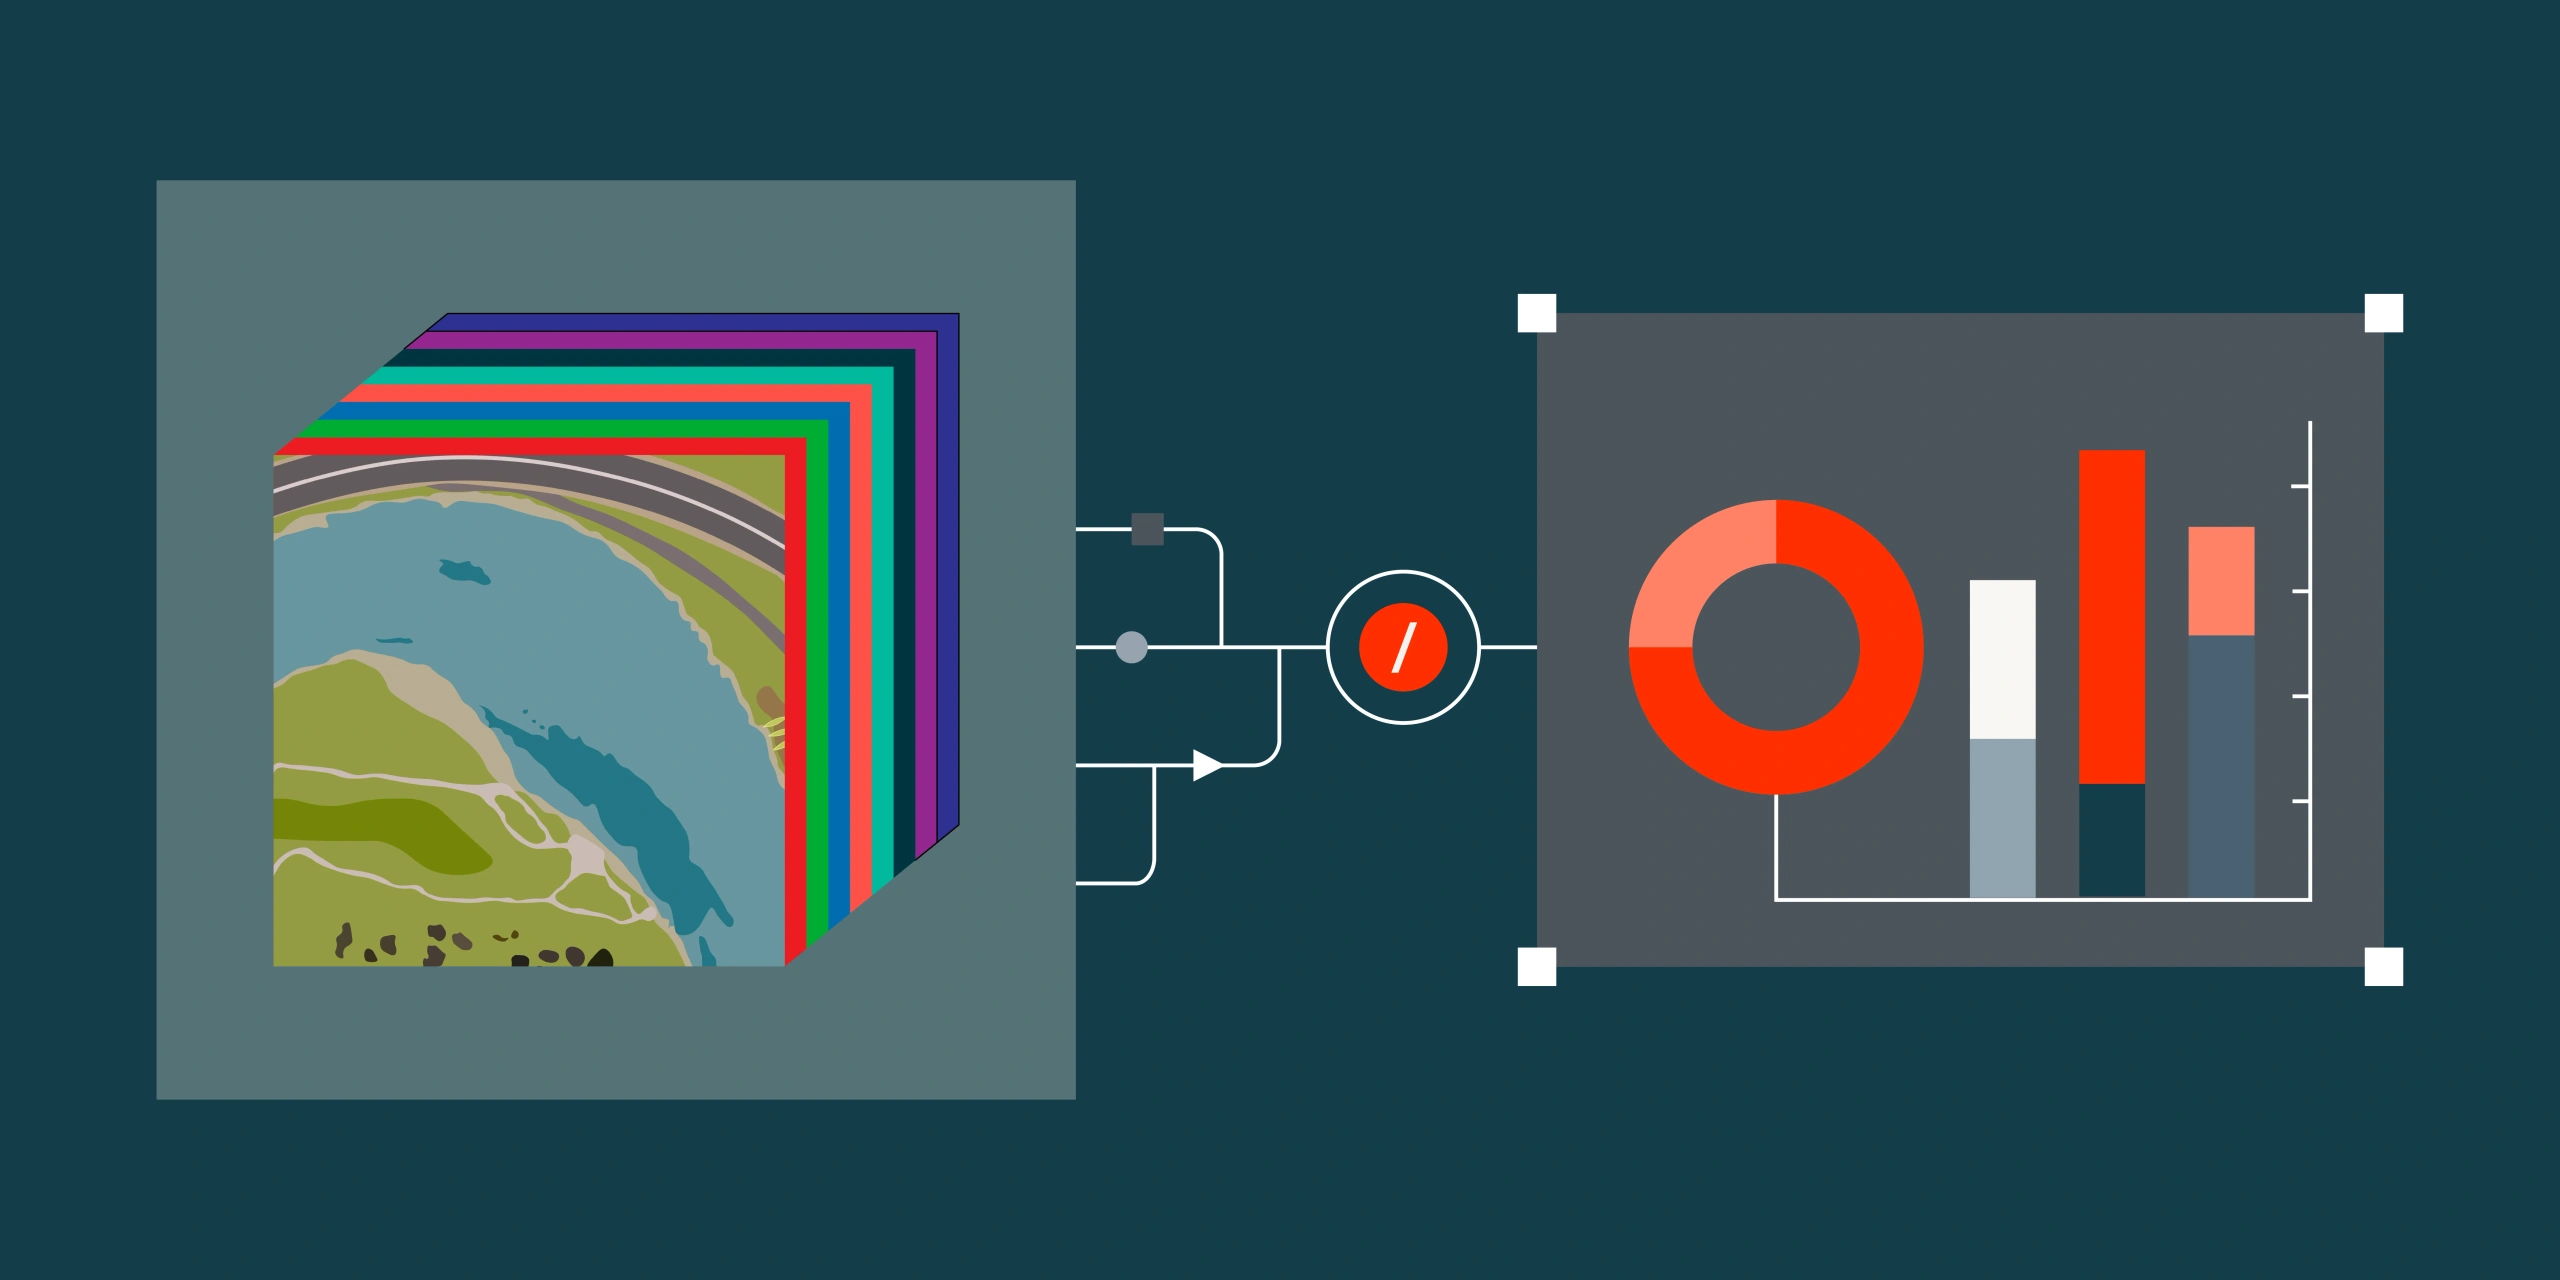
The ability to choose the right band combination or index is what turns satellite imagery from just a picture into a tool for analysis.
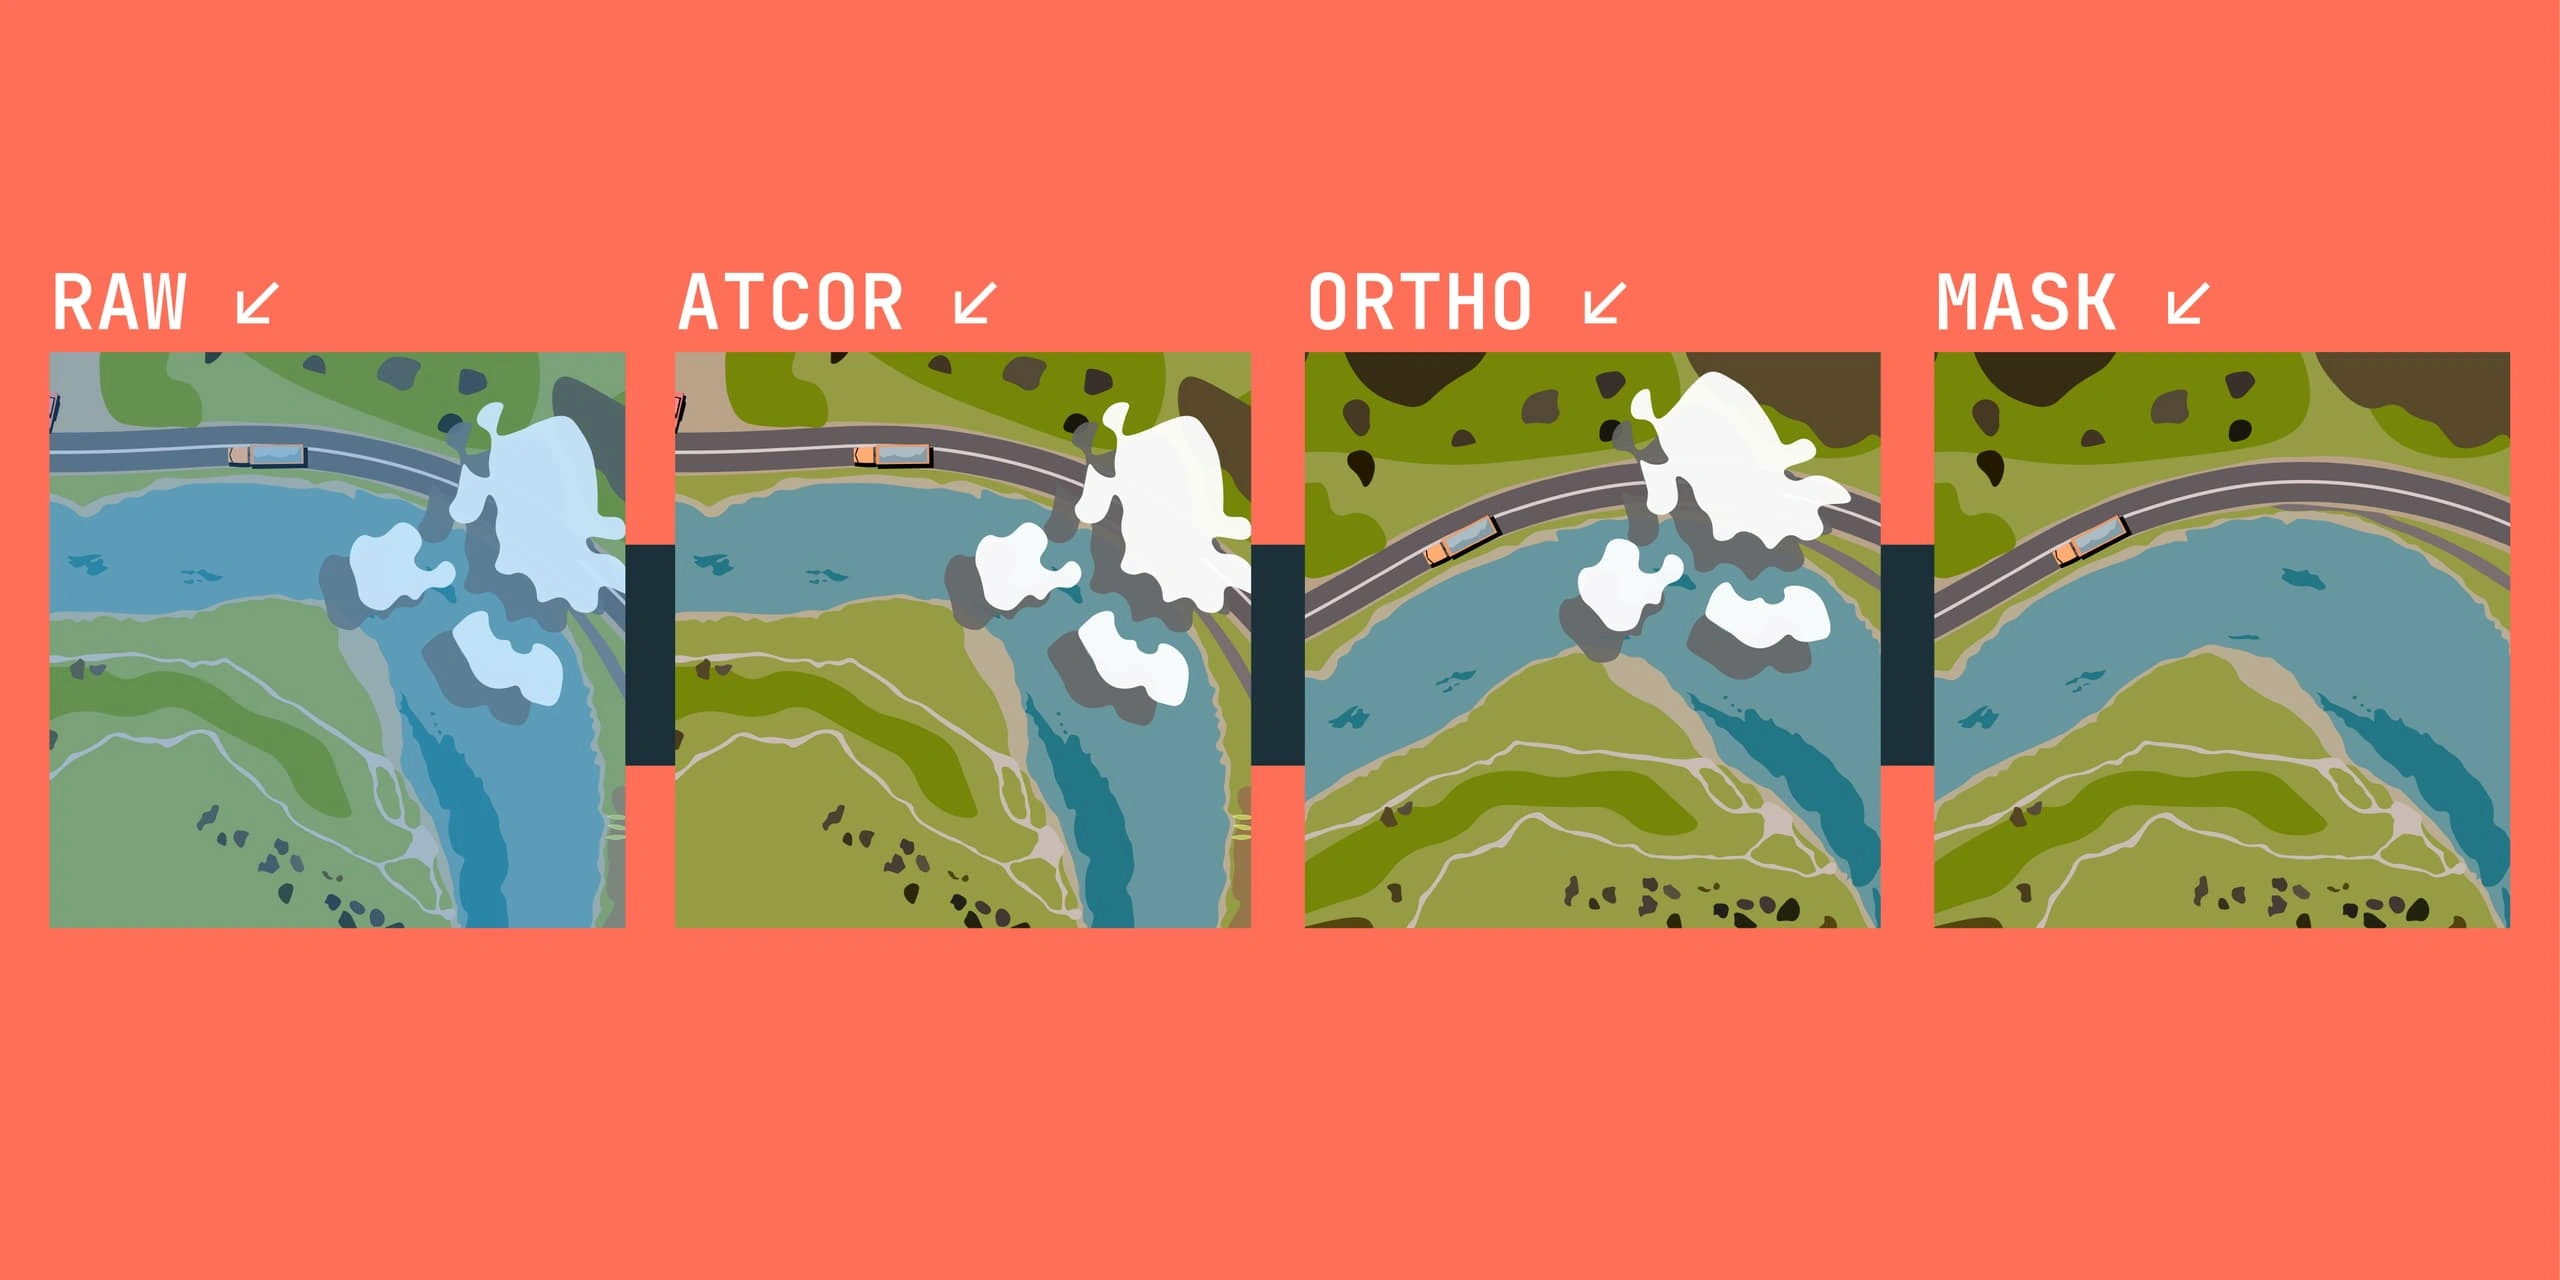
At Terrabit, all imagery is delivered analysis-ready - orthorectified and atmosphere corrected to surface reflectance. We can also include custom band combinations, indices and custom formats depending on the project requirements.
Ready to put multispectral analysis to work on your next project? Browse active constellations on the Satellites page, explore our Satellite Imagery products or request a tailored quote today.